In the EMMA performance report, you can view information about your communication campaigns, whether In-App or Out-App, and apply parameters and other values to group or filter the campaigns in order to obtain the desired information.
¶ Performance report
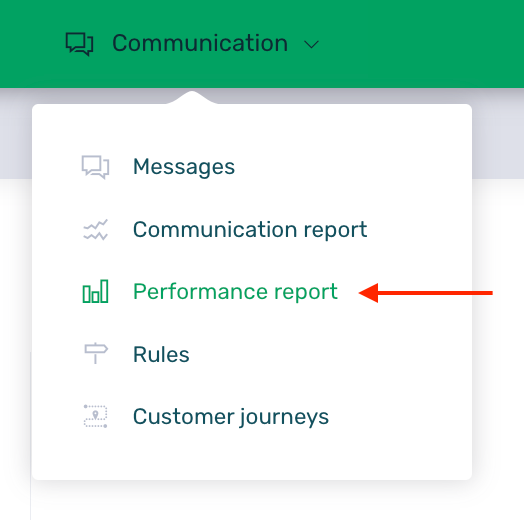
To access the performance report, you need to log in to your EMMA account and then go to the section Communication > Performance Report.
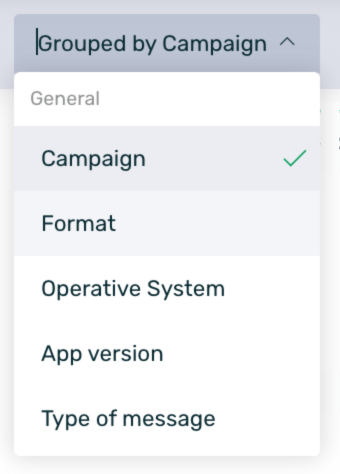
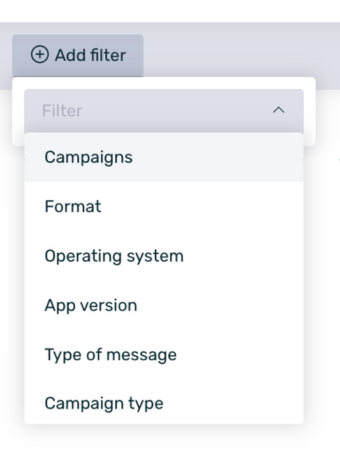
Once in this section, the first thing you can do is determine which KPI you want to group the information by and the filters you want to apply to filter the data among the following:
-
Campaign: Displays the list of all campaigns that have had data within the selected date range. If we filter by this KPI, it allows us to select a specific campaign.
-
Format: Groups and/or filters campaigns and data based on their format:
- Adball
- Banner
- Coupon
- Dynamic Tab
- Native Ad
- Prisma
- Push
- Startview
- Strip
-
Operating System: Groups and/or filters campaigns and data based on the operating system:
- Android
- iOS
-
App Version: Groups and/or filters campaigns by the app version from which they were viewed.
-
Message Type: Groups and/or filters campaigns by message type:
- In-App
- Out-App
-
Campaign Type: Groups and/or filters campaigns based on the type of campaign:
- Manual
- Automatic for rules
- Automatic for customer journeys
-
Category: Groups and/or filters campaigns based on the category linked to each campaign.
-
A/B Test: Filters communications based on whether they have an A/B test configured or not.
-
Communication Parameters: Groups and/or filters campaigns based on the communication parameters linked to each campaign.
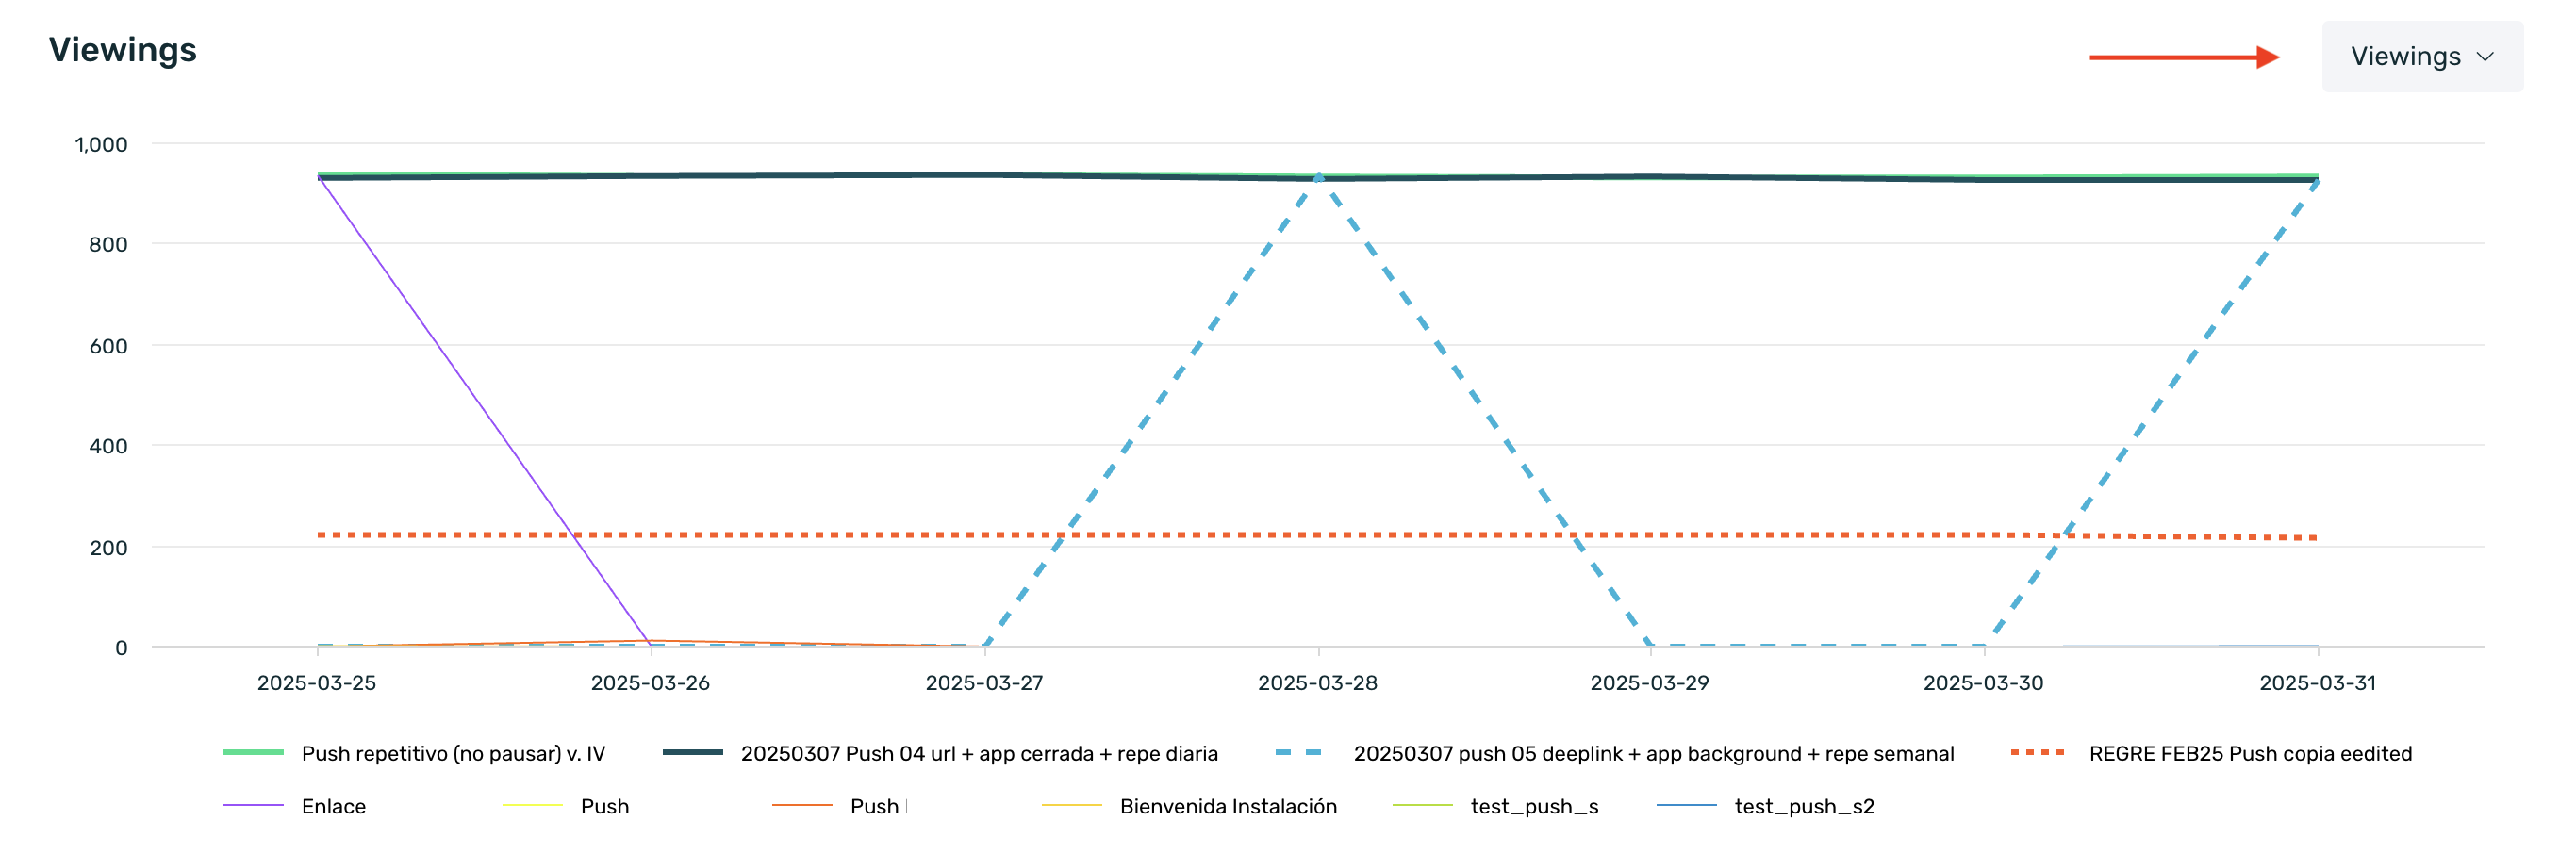
The first graph displayed when accessing this report allows us to see the evolution of campaigns within the selected date range based on the chosen KPI.
- Viewings: Total views recorded for each communication. For Out-App communications, sends are counted as impressions.
- Unique Visualizations: Unique customer IDs that have viewed each communication.
- Clics: Total clicks made on each communication. For Out-App communications, opens are counted as clicks.
- Dismissals: Total clicks on the close button of the communication. This information is available for the Adball, Native Ad, and Startview formats.
By default, this graph shows the volume of views for communications. However, by clicking on the selector in the upper right corner of the graph, we can change the KPI displayed. Additionally, the data can be viewed grouped by day, week, or month. For more information on time-based grouping, click here. Keep in mind that the way information is displayed depends on the selected grouping.
By default, this graph will display the top 10 campaigns with the highest volume within the selected date range. The remaining campaigns will be grouped under "Others."
In the second graph, we can see the total number of views for each campaign within the selected date range. This table will present the data based on the previously chosen grouping.
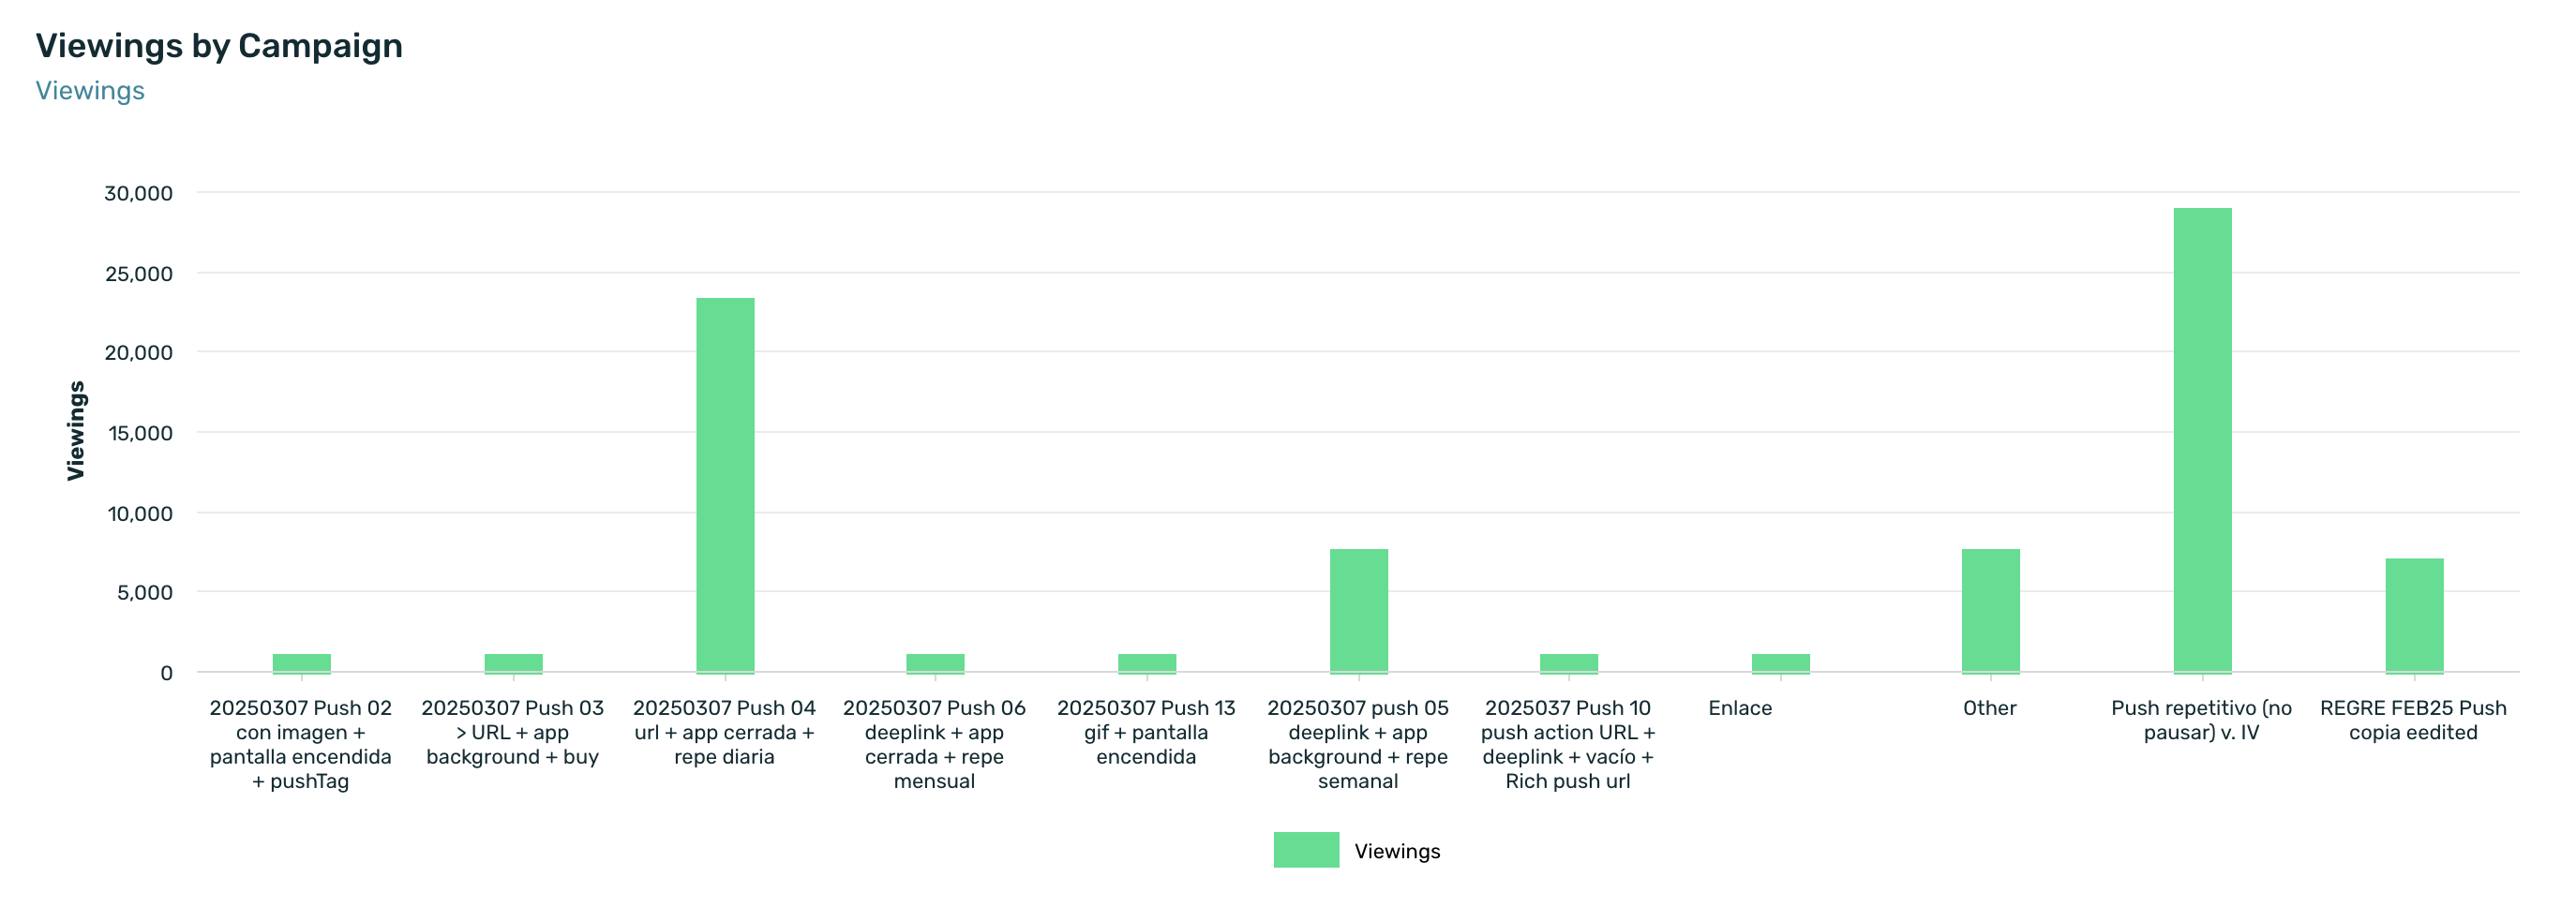
Both graphs display information about total views or clicks achieved by the communications (except in cases where unique counts are specified).
Finally, we can see the campaign summary table. This table, like the rest of the screen, will present the data differently depending on the selected grouping and/or filters.
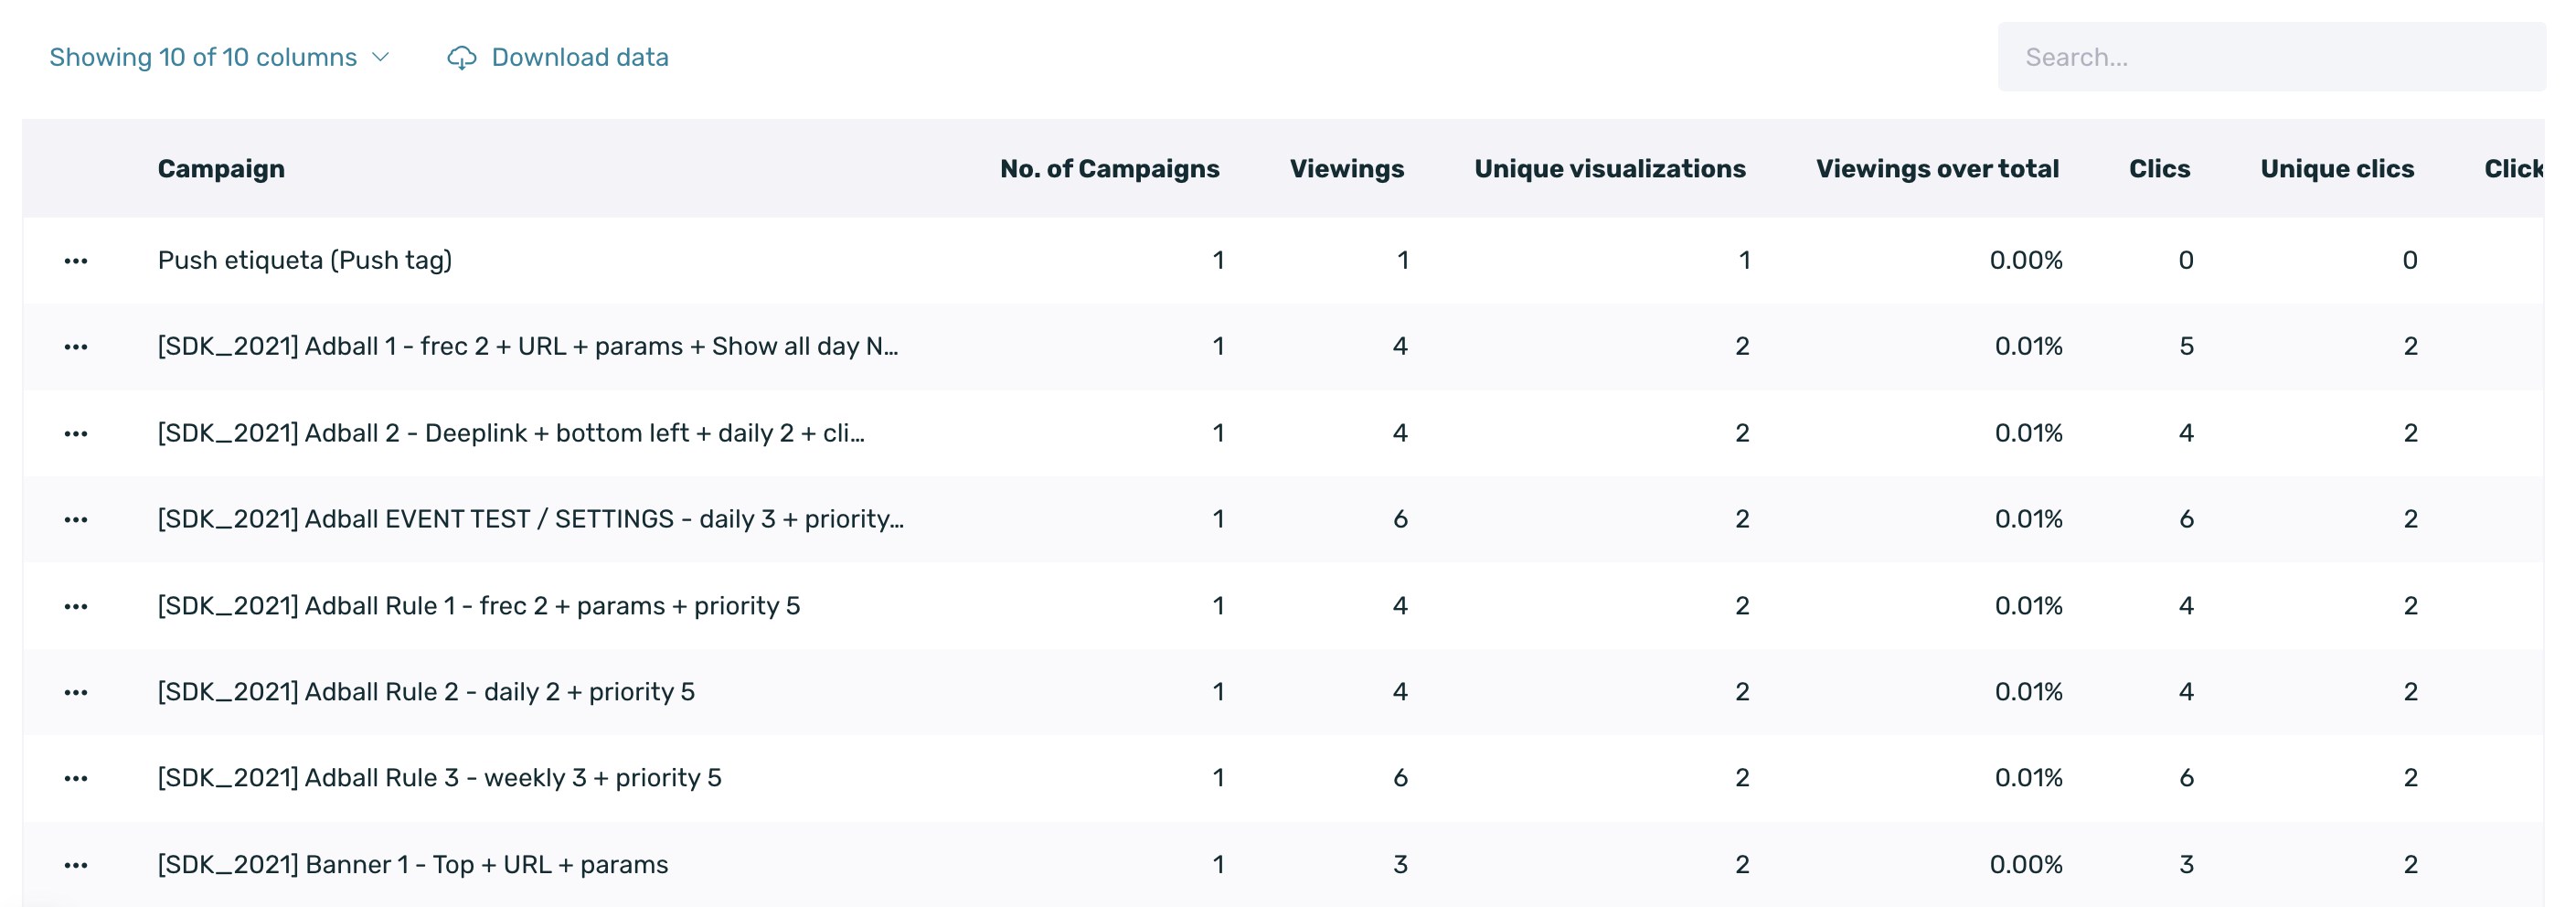
Just like in other EMMA tables, you can select the columns you want to display and search for a specific value using the search bar at the top right of the table.
In this table, you will see the following information:
- Campaign: This KPI changes based on the selected grouping, displaying relevant information accordingly.
- Number of campaigns: When grouping by something other than "Campaign", e.g., "Format", this shows the number of campaigns per format.
- Viewings: Total views per communication. For Out-App communications, deliveries are counted as impressions.
- Unique visualizations: Unique customer IDs that have viewed each communication.
- Viewings over total: Percentage of views over the total views. Formula: (Views of the communication / Total views) * 100.
- Clics: Total clicks per communication. For Out-App communications, opens are counted as clicks.
- Clicks over total: Shows the % of views over the total number of views. The calculation would be views of the specific communication divided by the total views, multiplied by 100.
- CTR: Percentage of devices that have clicked on the communication among the total impressions of said communication.
- Dismissals: Total clicks made on the close button of the communication. This information is available for the formats Adball, Native Ad, and Startview.
¶ Creating audiences from the performance report
From the performance report, audiences can be created based on the devices that have been impacted by the communication(s) (views) or based on the devices that have interacted with the communication(s) (clicks).
To create an audience, follow these steps:
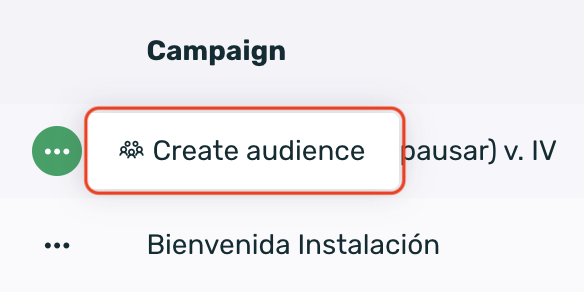
- Go to the summary table of the communications.
- Hover over the specific contextual menu.
- Click on the Create audience option.
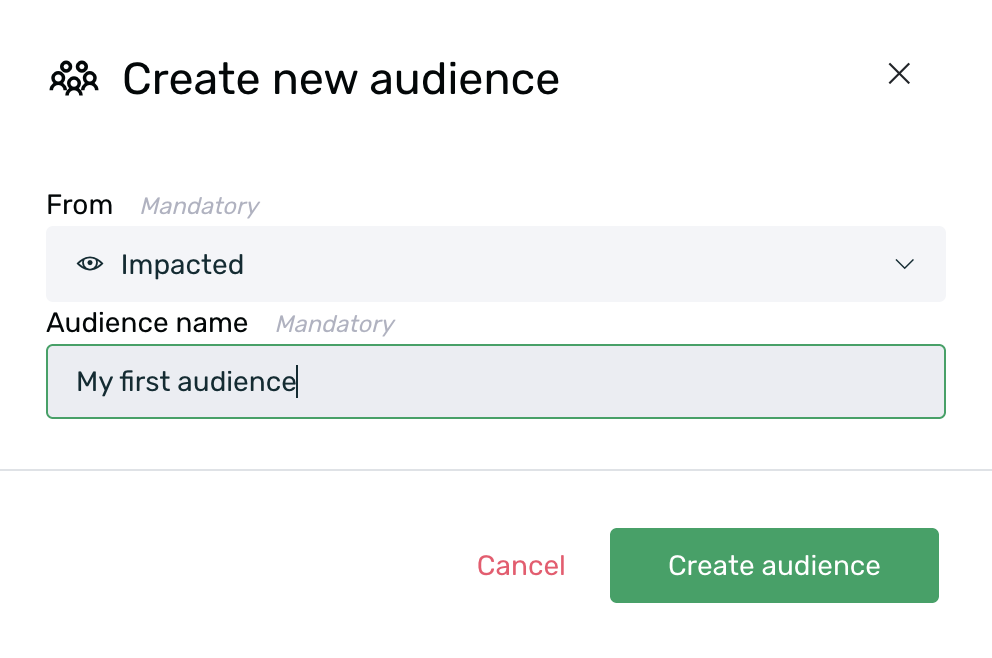
In the creation form, in the From selector, choose the desired option:
-
Impacted: Creates the audience based on the devices impacted by the communication(s) within the selected date range. This audience is static and only considers users who meet the condition at the time of creation.
-
Conversions: Creates the audience based on the devices that have clicked on the communication(s) within the selected date range. This audience is static and only considers users who meet the condition at the time of creation.
-
Set an identifiable name for the audience and click the Create Audience button.
And that's it! Your audience based on the communication data has been created. You can check the audience in the Behavior > Audiences section and use it to create new In-App or Out-App communications.
¶ Histograms
With EMMA's histogram report, we can see the distribution of users who have clicked or viewed a certain number of campaigns within a specific period.
In the filtering bar, we can apply different filters to obtain information for a particular month and compare it with another selected month if needed.
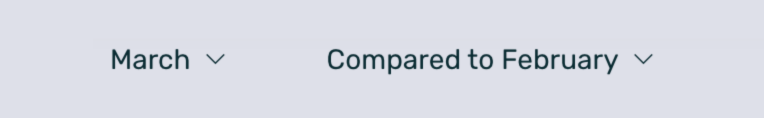
The histograms display information for completed days only. Data for the current day is not shown.
Additionally, it is not possible to select a custom date range; data can only be viewed month by month.
We can view information from two different histograms. Click histogram and view histogram.
¶ Histogram of clicks
In the click histogram, we can see the distribution of users (%) who have clicked on a certain number of campaigns within a specific period (months).
By default, the data for the current month is displayed, but we can select a different month using the filter bar, as well as choose whether to compare it with another month. If communication parameters have been enabled for use in histograms, they can also be used to filter the displayed data. You can find more information about communication parameters here.
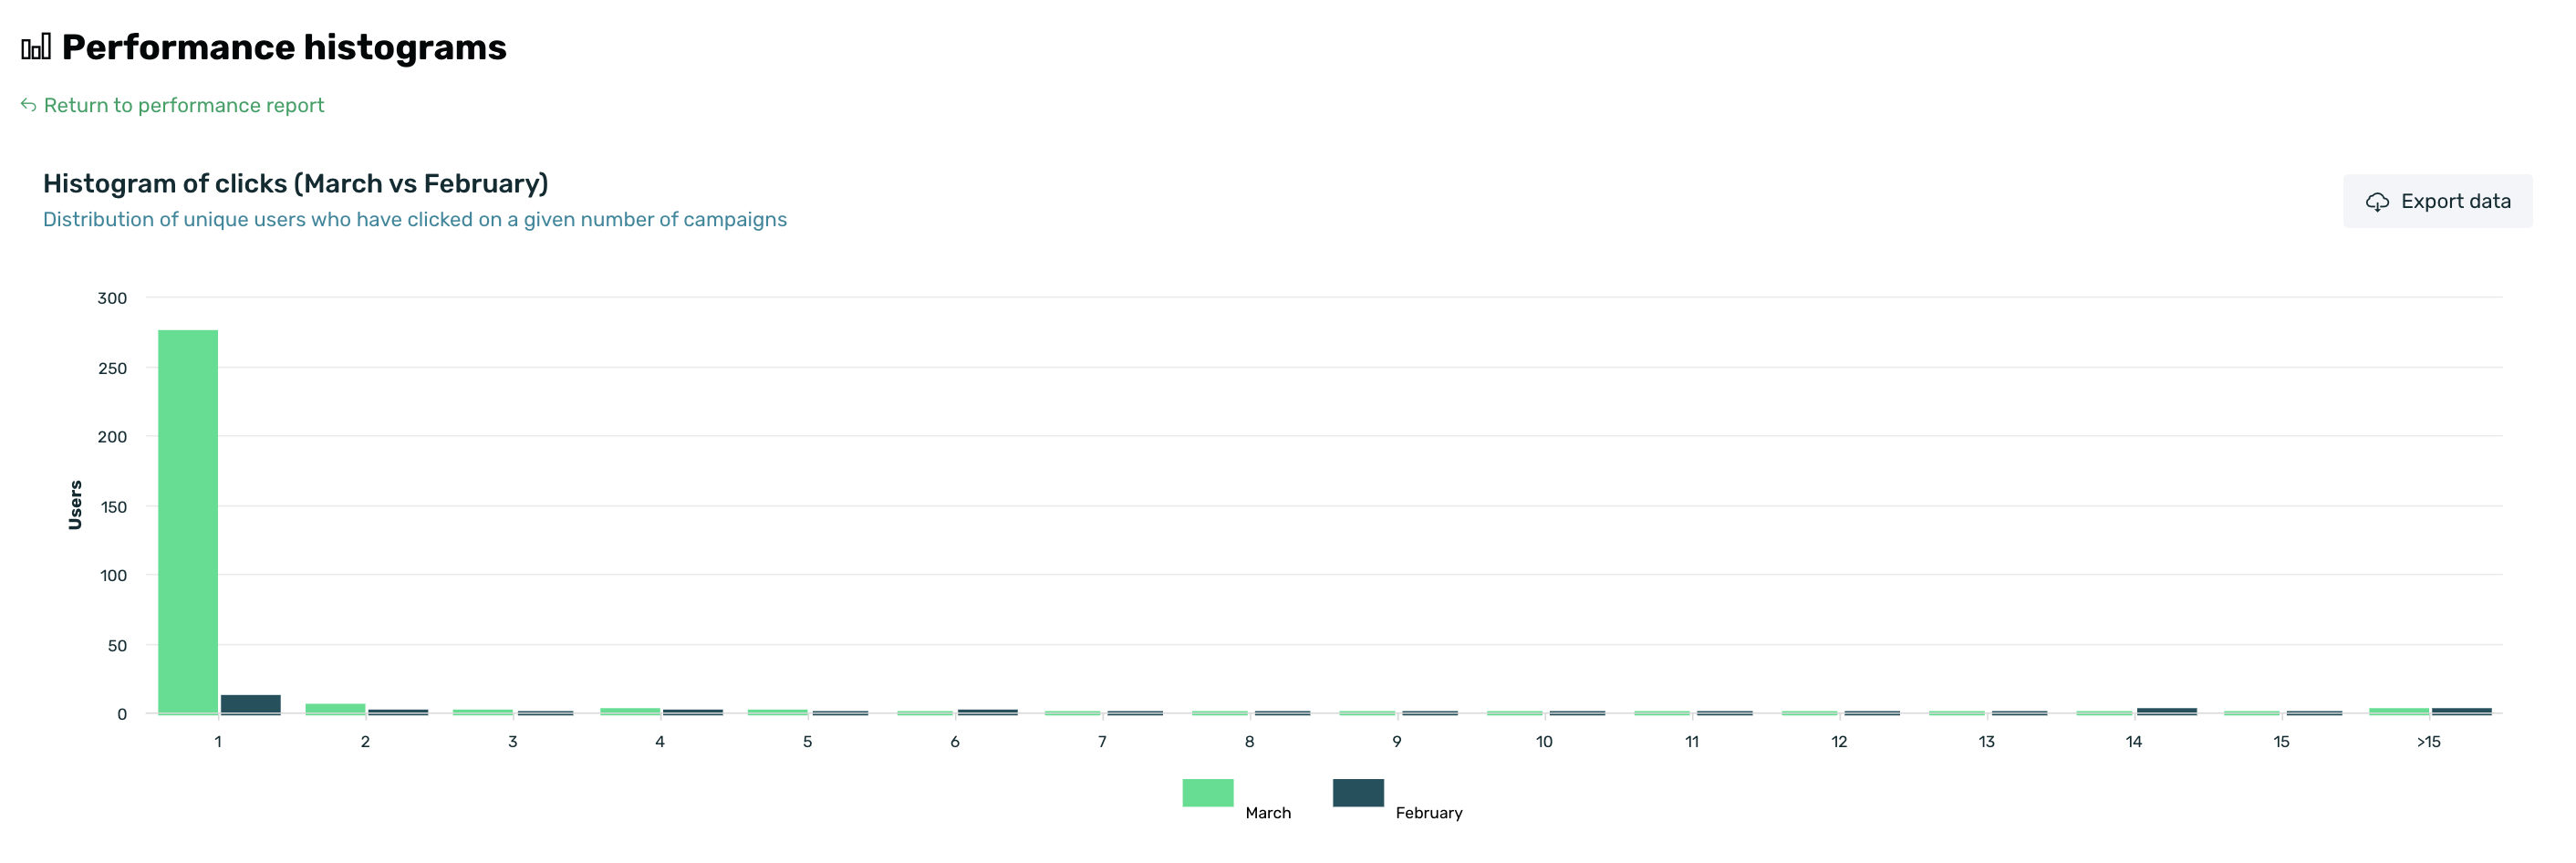
The % represents distinct users (client IDs) who have clicked on X number of different campaigns.
¶ Histogram of views
In the view histogram, we can see the distribution of users (%) who have viewed a specific number of campaigns within a given period (months).
By default, the information for the current month is displayed, but we can select another month using the filter bar, as well as choose a month for comparison or not.
Histograms, they can also be used to filter the information shown in the histogram. You can see more info about communication parameters here.
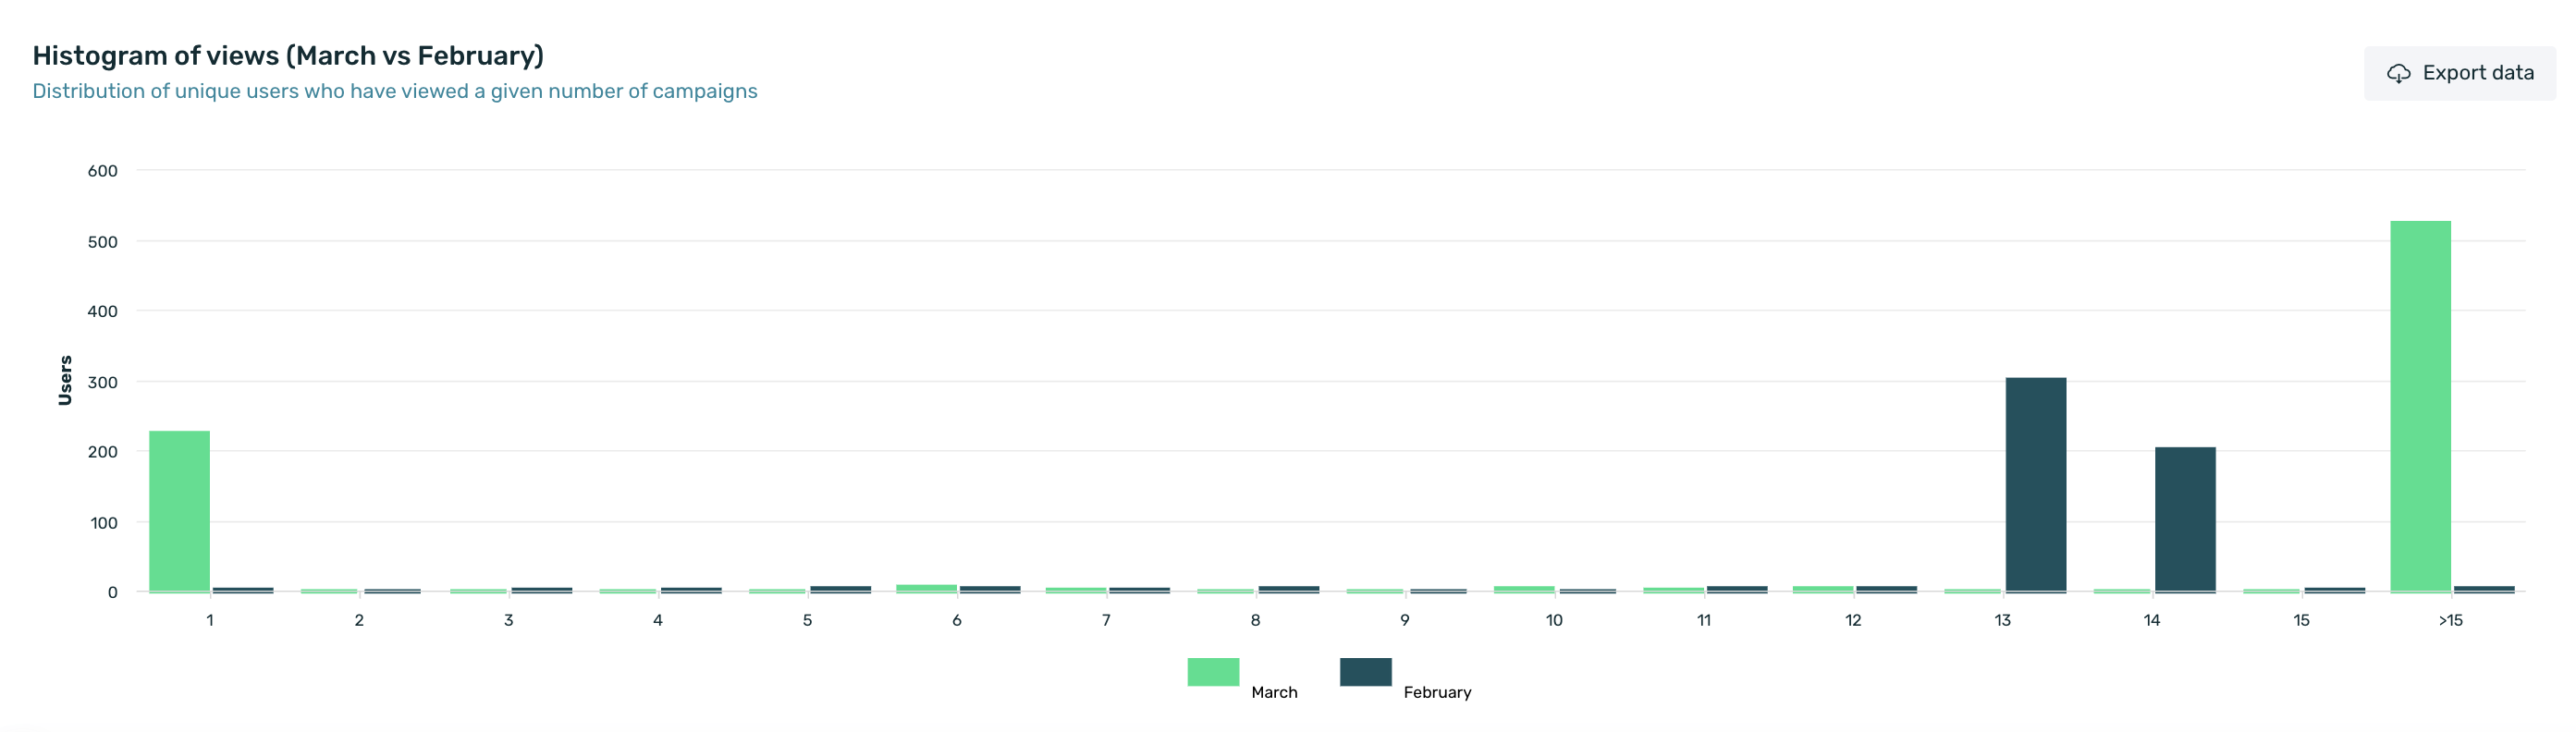
The % are distinct users (client ID) who have viewed x number of different campaigns.