¶ Introduction
On the Installs screen, you can view general data regarding campaign installs obtained by the app within a specified date range. This allows us to quickly analyze how campaigns are performing based on the volume of app installs.
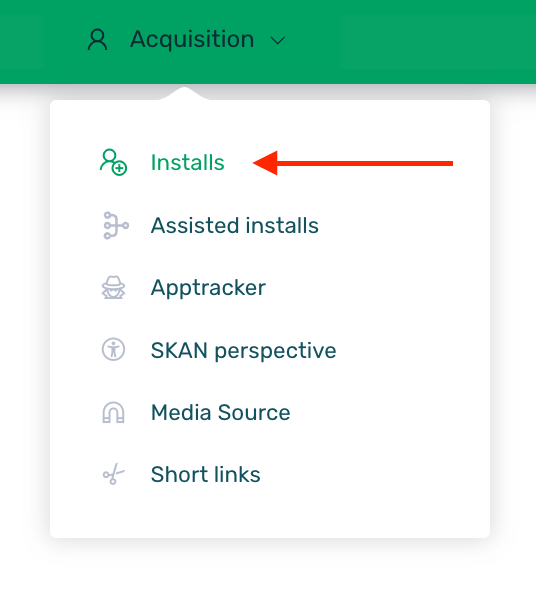
To view and interpret all this data, you need to access the section Acquisition > Installs.
Please note that all the data displayed on this screen will be based on the selected date range. Additionally, we can choose to have the graph data grouped by days, weeks, or months. For more information about grouping and date ranges, click here.
In the first section of the screen, we can see a table with information on the basic KPIs:
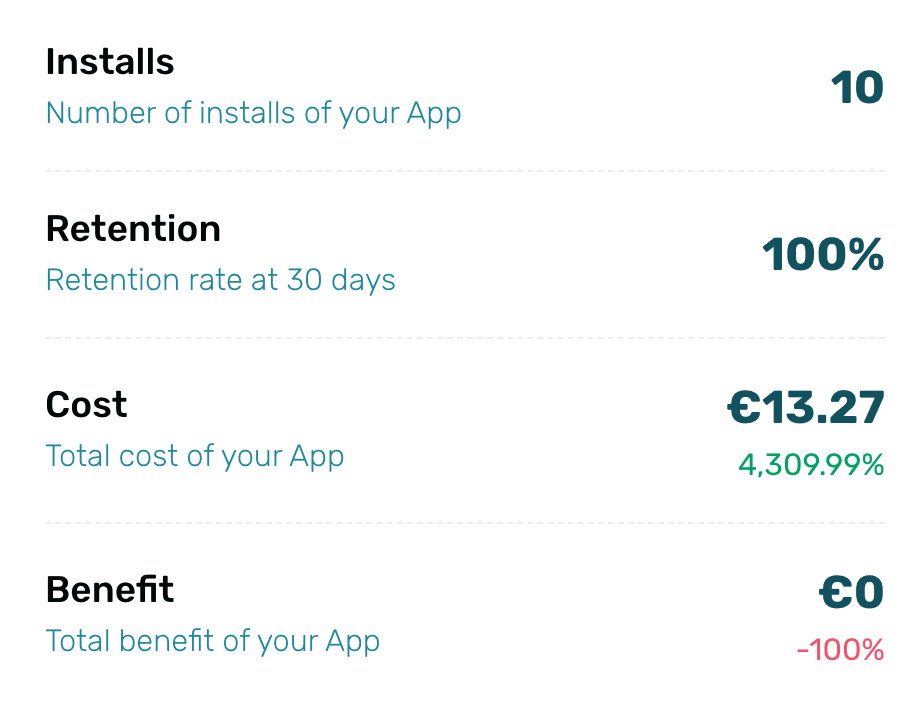
- Installs: Number of users who have installed the app in the selected date range.
- Retention: Retention rate (last 30 days) of users who have downloaded the app in the selected date range.
- Cost: Budget spent on the campaigns carried out.
- Benefit: Total benefit obtained from the campaigns performed.
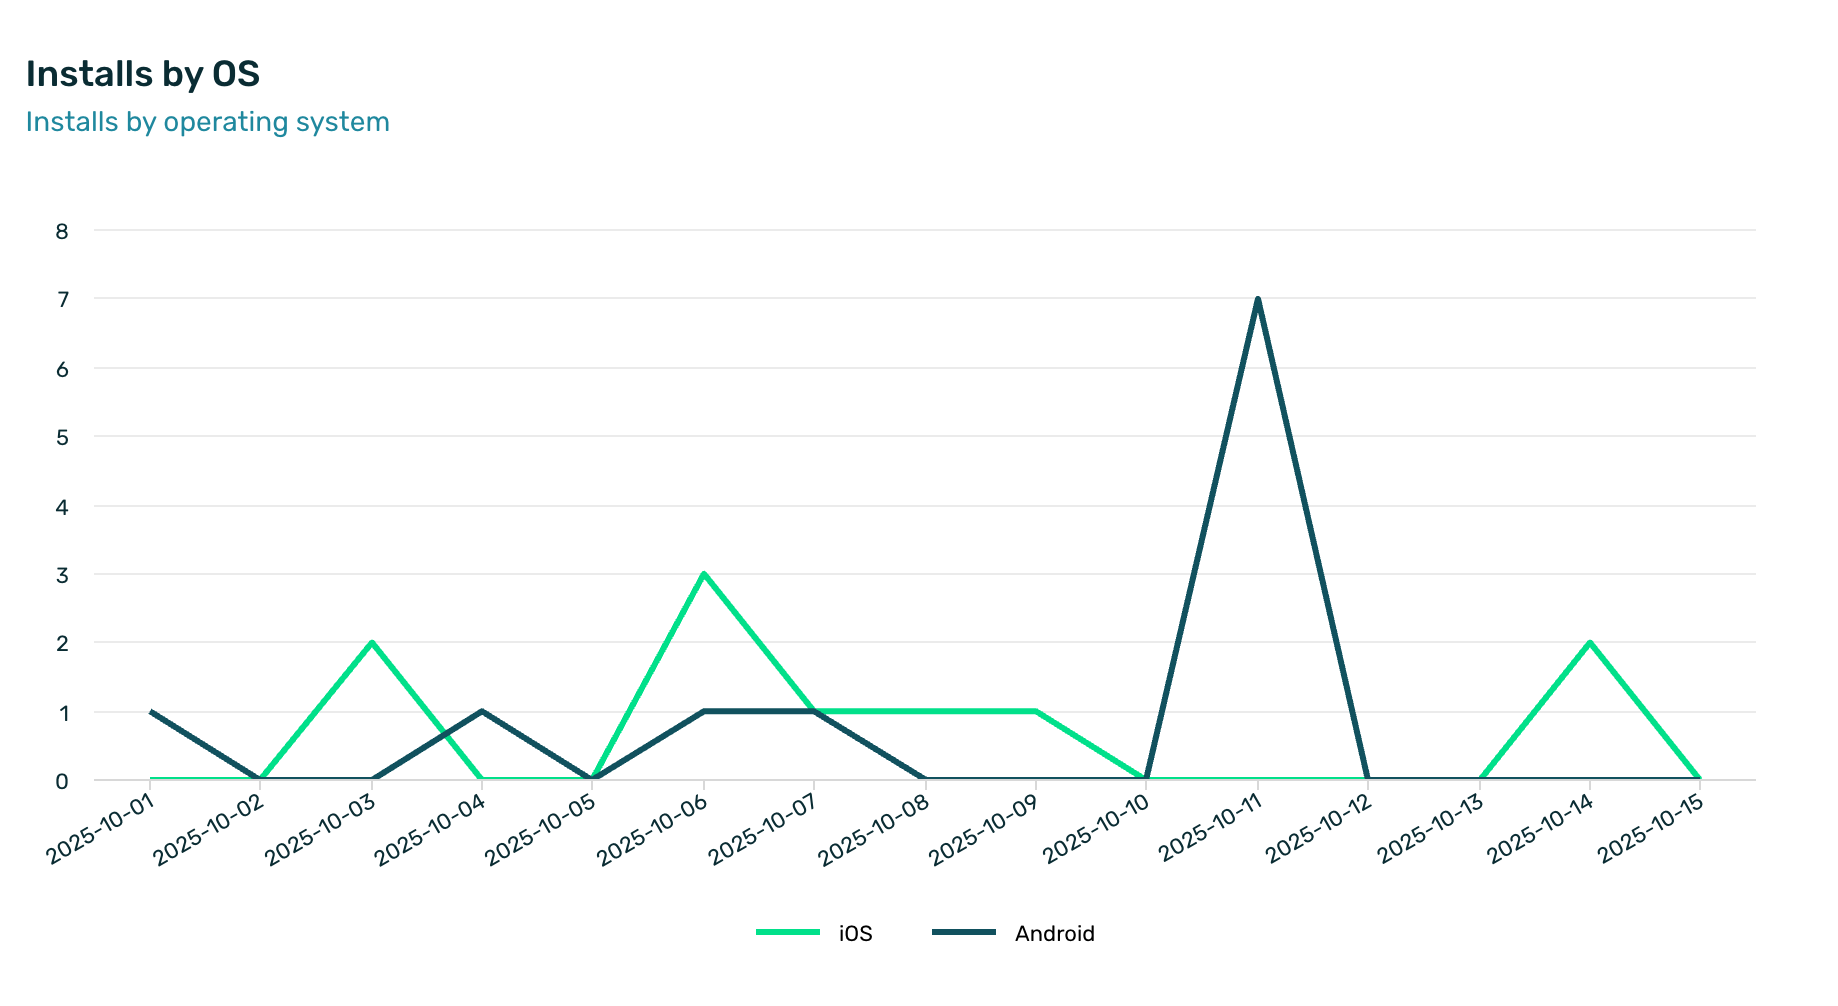
¶ Installs by OS (Operating System)
In the first graph, which we can see in the upper right part of the screen, we can see the information of the installs broken down by operating system in the selected date range.
If we mouse over the graph we can see more detailed information on the number of installs of each operating system.
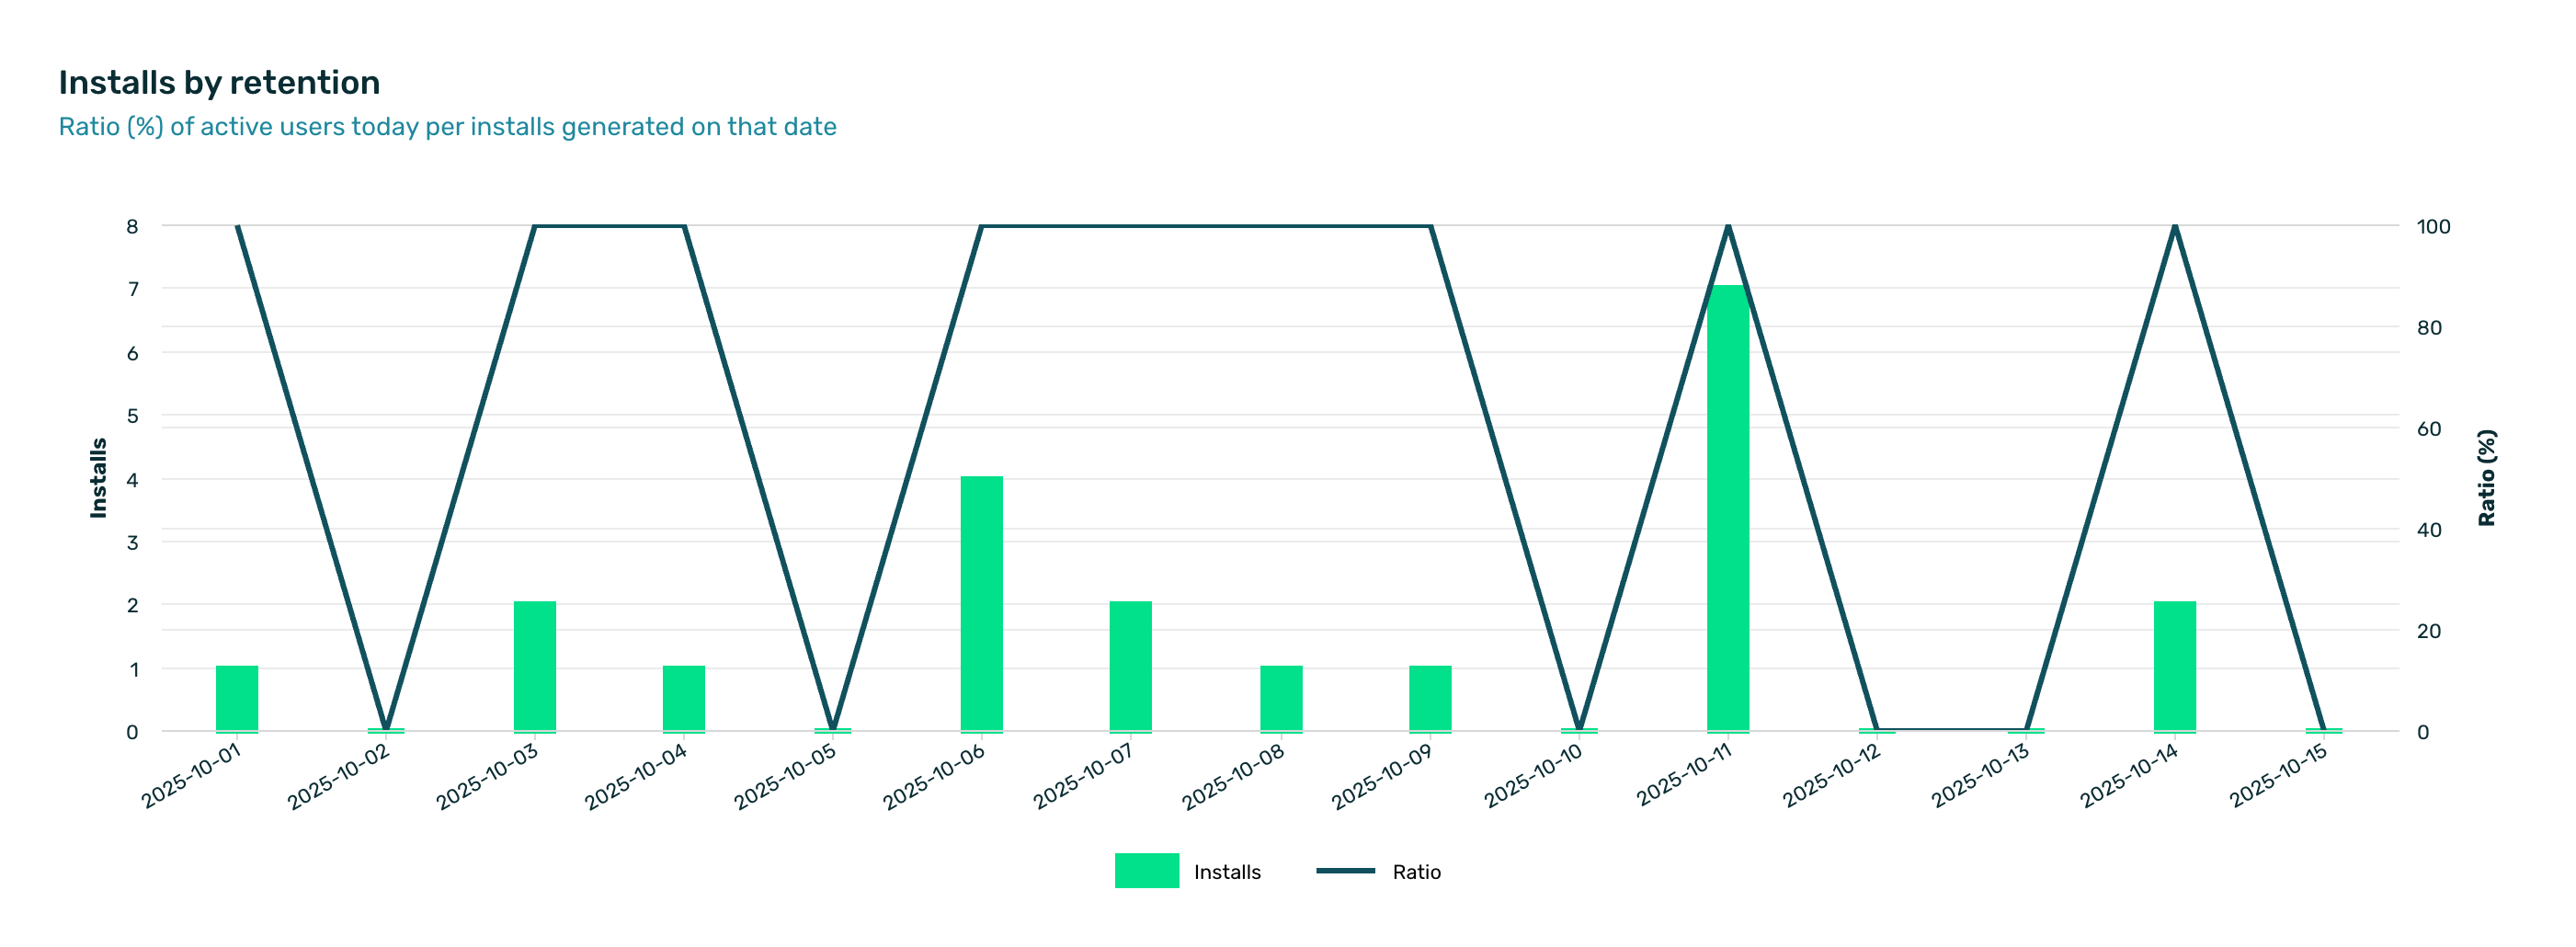
¶ Installs by retention
In the following graph we can see in detail the breakdown of the installs of each day, week or month and the retention ratio of these installs over the last 30 days. That is, we can see what % of users who installed the app on a given date continue to open the application in the last 30 days (from the current day). In this way, we can carry out an analysis of the quality of traffic that we are generating in our app.
If we mouse over the graph we can see detailed information on the number of installs and the retention rate of those particular installs. It is normal that the installs of the last 30 days show a retention rate of 100%.
¶ Installs worldwide
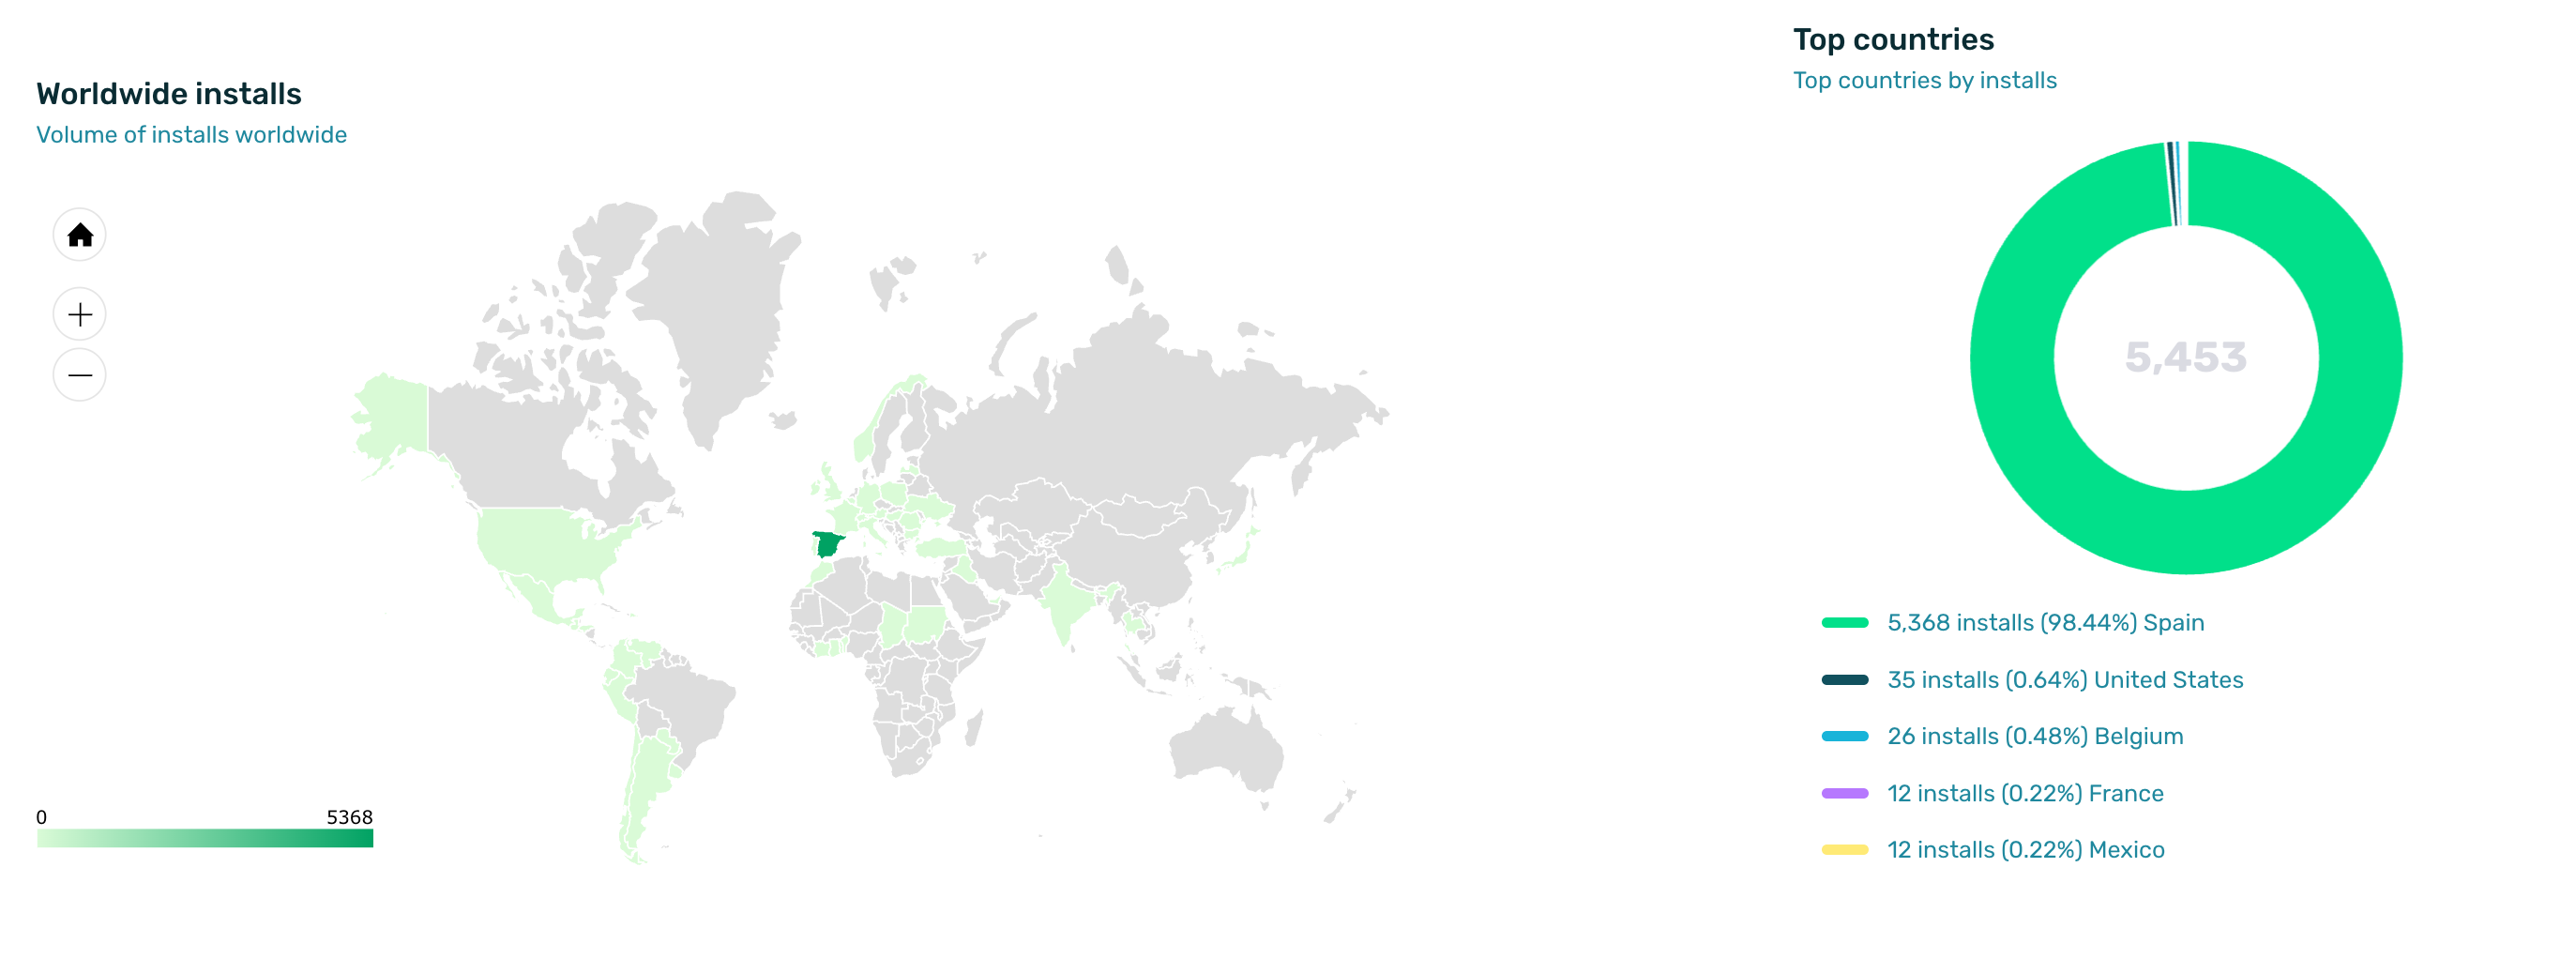
In the penultimate graph of this screen we can see the installs around the world. That is to say, we can see from which countries the installs of our app come from.
On one side we can see on a map the countries that are generating installs (marked with green color) and on the other side a graph in which we can see more clearly the main countries from which our installs come from.
If your app is focused only on the Spanish market but you see installs from the USA do not worry, it is normal. Keep in mind that both Apple and Google perform a review of all the apps that are uploaded to the respective stores to ensure that the content of the app is not inappropriate. To do this, they have to perform downloads of the app which are reflected in EMMA and in this chart.
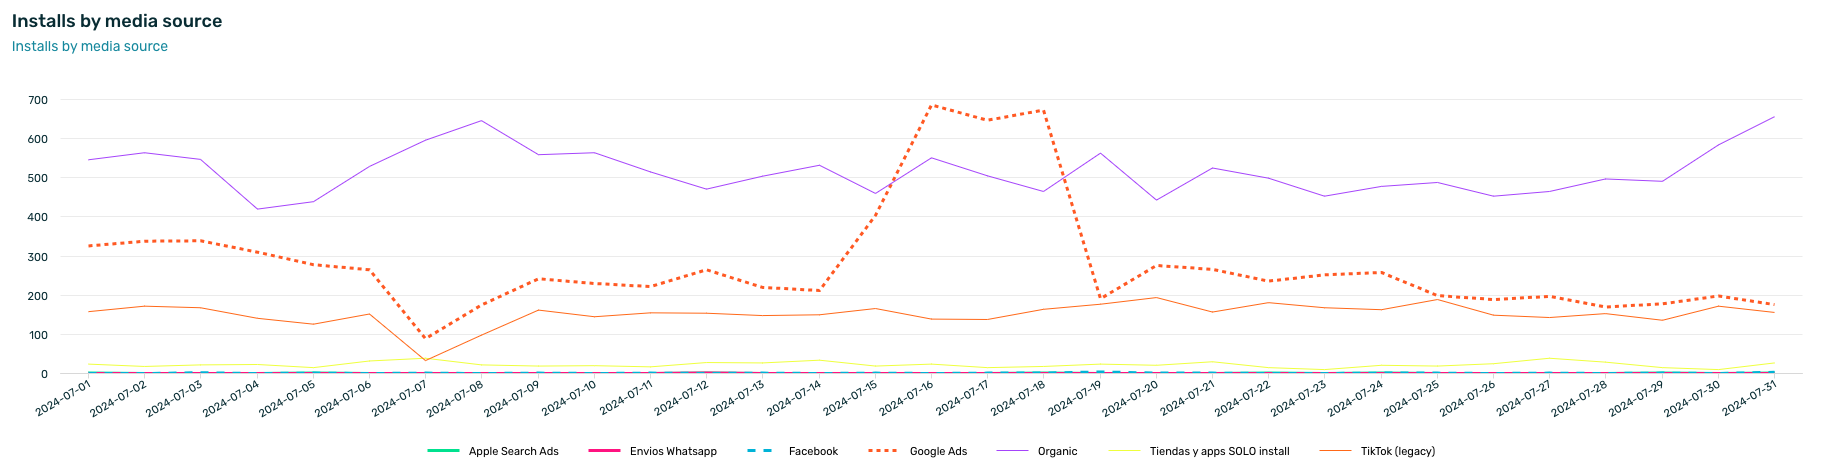
¶ Installs by media source
In this last graph we can see which traffic sources are generating more installs for your app. Thus, we can know and locate in a simple way the providers that are bringing a greater number of conversions to the app.
If we mouse over the graph we can see the specific information of the providers that have generated installs on that particular day.
¶ Frequently Asked Questions
1. Why do I see US installs if my app is only for the Spanish market?
It is normal that you see US installs even though your app is not available in that market. These are the most common causes of these installs:
- When an app is uploaded to the stores, it goes through a validation process by Google and Apple. These companies are located in the USA, so in this validation process US installs are generated.
- During the app development process, developers use simulators to launch tests that can simulate a US, Germany or other geolocation.
- Because of the IP address translation. The IP address translation may have resulted in a US location. The IP address is not as reliable as the geolocation of a device.
- It is possible that there are users who have traveled and have made the connection from the USA, therefore, even if they have the Spanish store configured in the app, the translation of the IP address results in the USA.