¶ Events detail
The Events Detail screen allows you to perform an in-depth analysis of each event tracked in the application. This way, you can follow the time-based evolution of each event and better understand user behavior within the app.
To access this screen, simply follow these steps:
- Log in to your EMMA account.
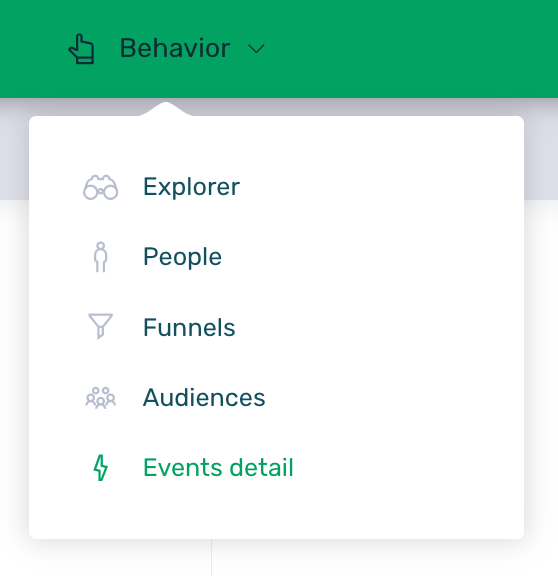
- Go to the section: Behavior > Events detail.
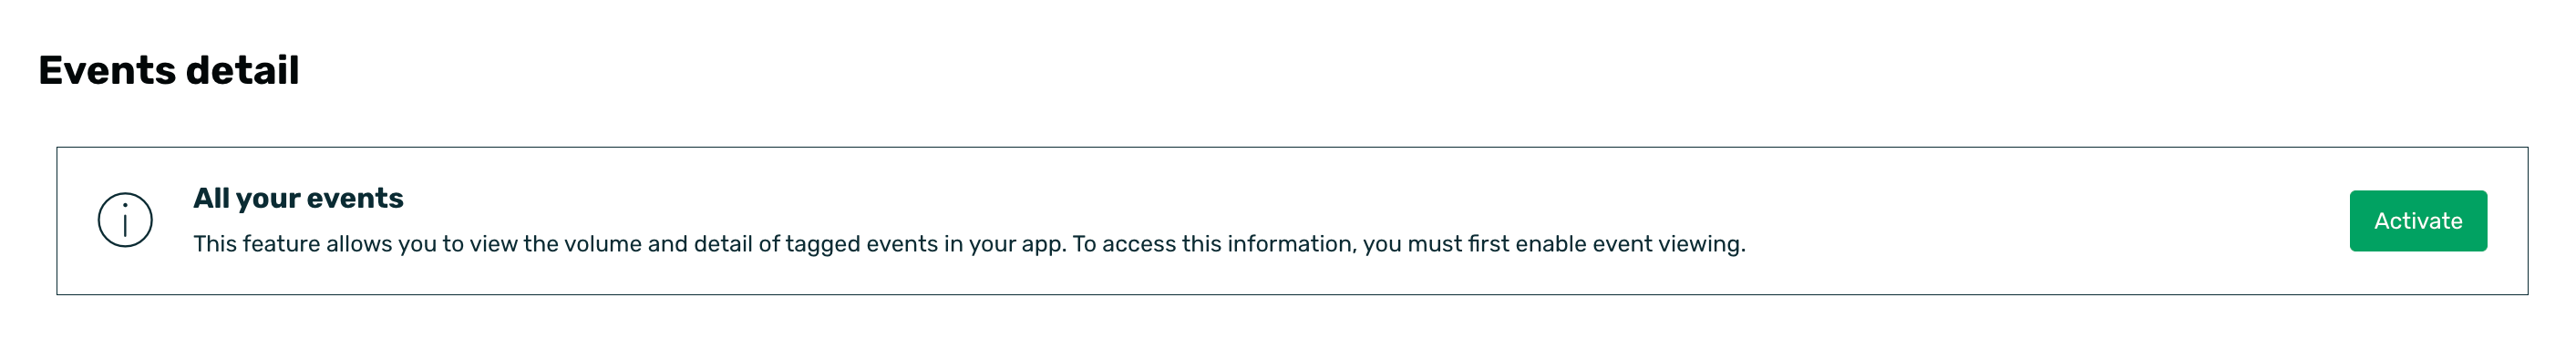
To start viewing data on this screen, you need to enable event tracking. To do this, simply click the Activate button in the warning message displayed when accessing this section.
Please note that data collection may take up to 24 hours from the moment it is activated.
This screen includes several filters to obtain the desired information. You can find more information about the available filters here.
¶ Main events
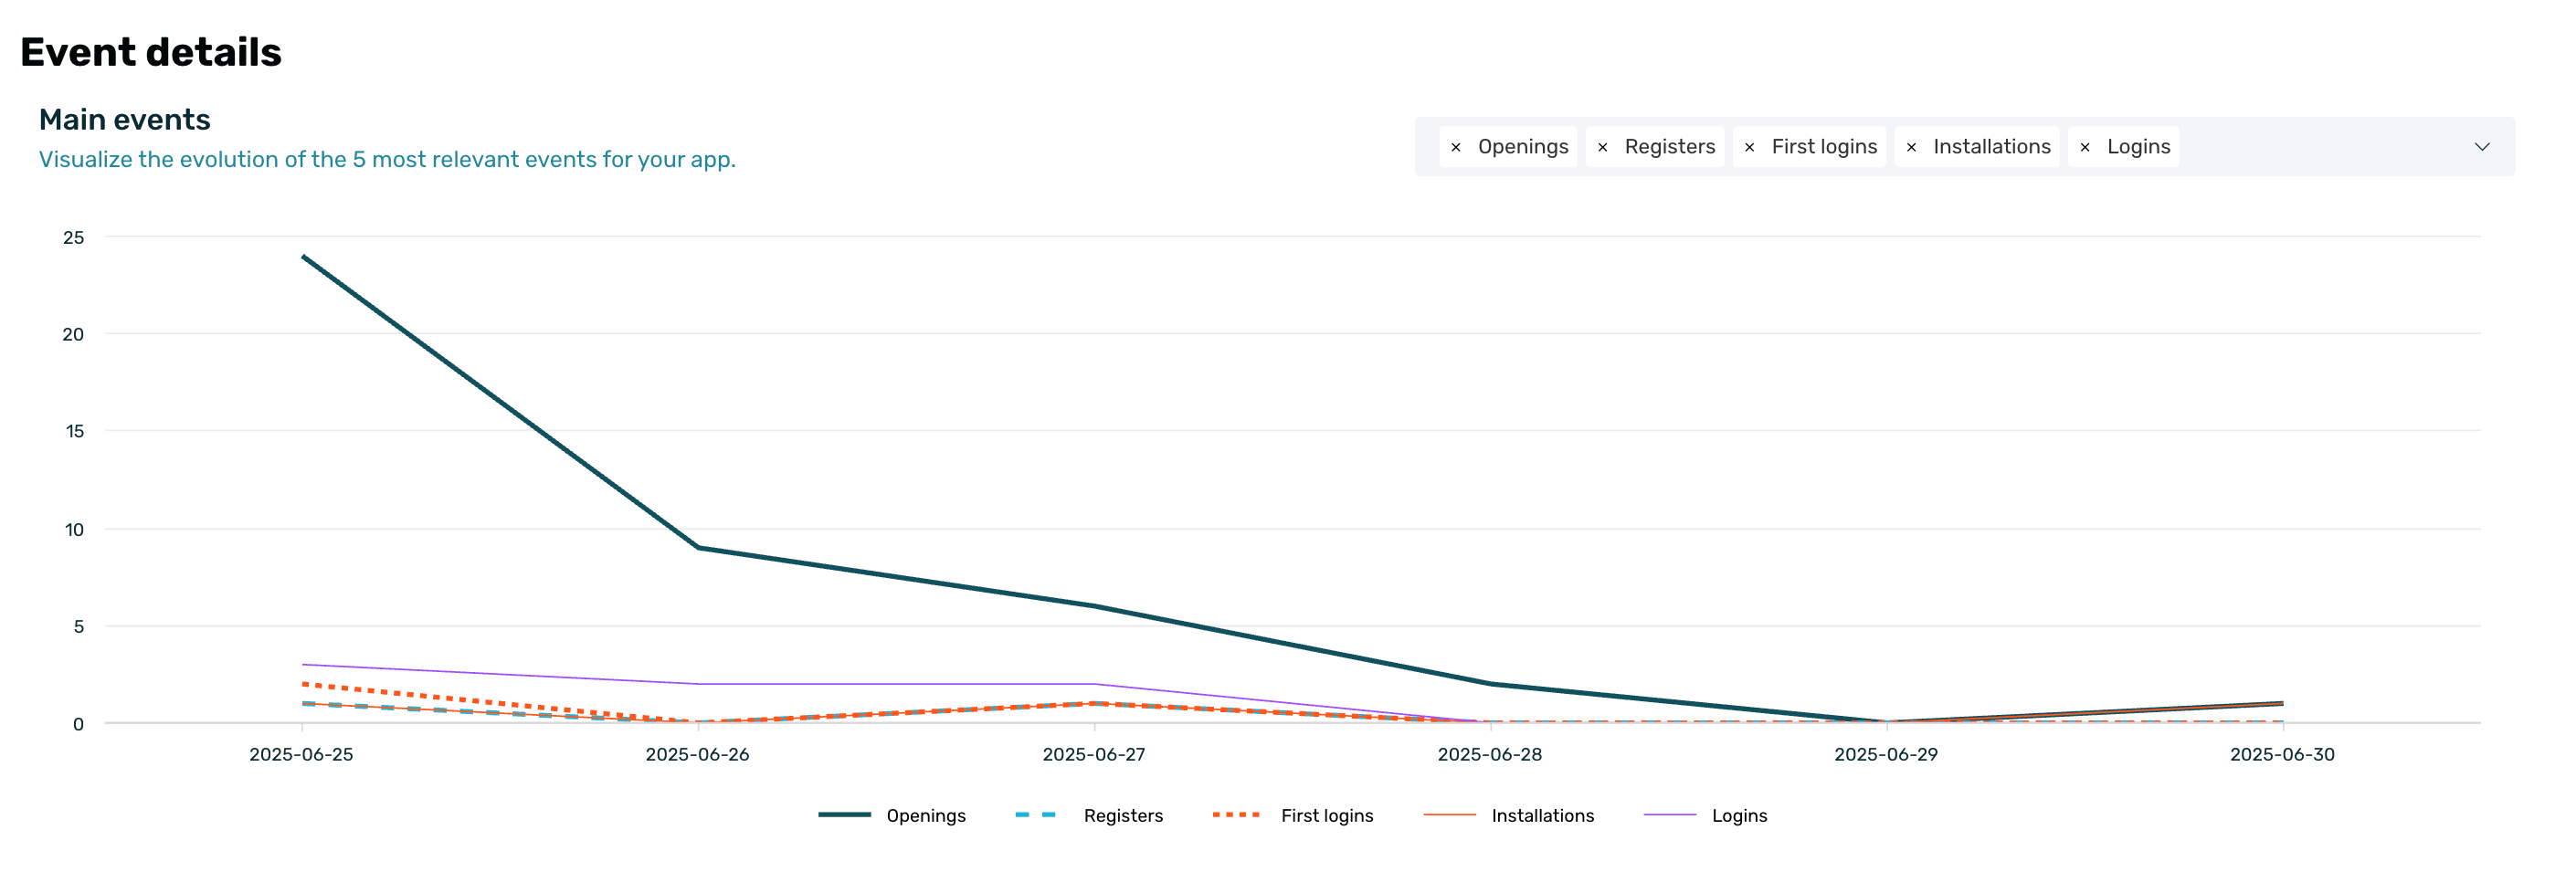
Once data collection has started, the first thing you’ll see is a chart displaying the evolution of the 5 most relevant events in the application. Using the selector in the upper-right corner of the chart, you can choose which events to display—up to a maximum of 5.
This allows for a more visual access to the data for the selected events within the chosen date range. Additionally, the data in the chart can be grouped by days, weeks, or months. depending on the analysis needs at any given time. You can find more information about grouping here.
¶ Event analysis
At the bottom of the screen, you can see a table containing the details of all events and their evolution, allowing for a more detailed analysis of each individual event.
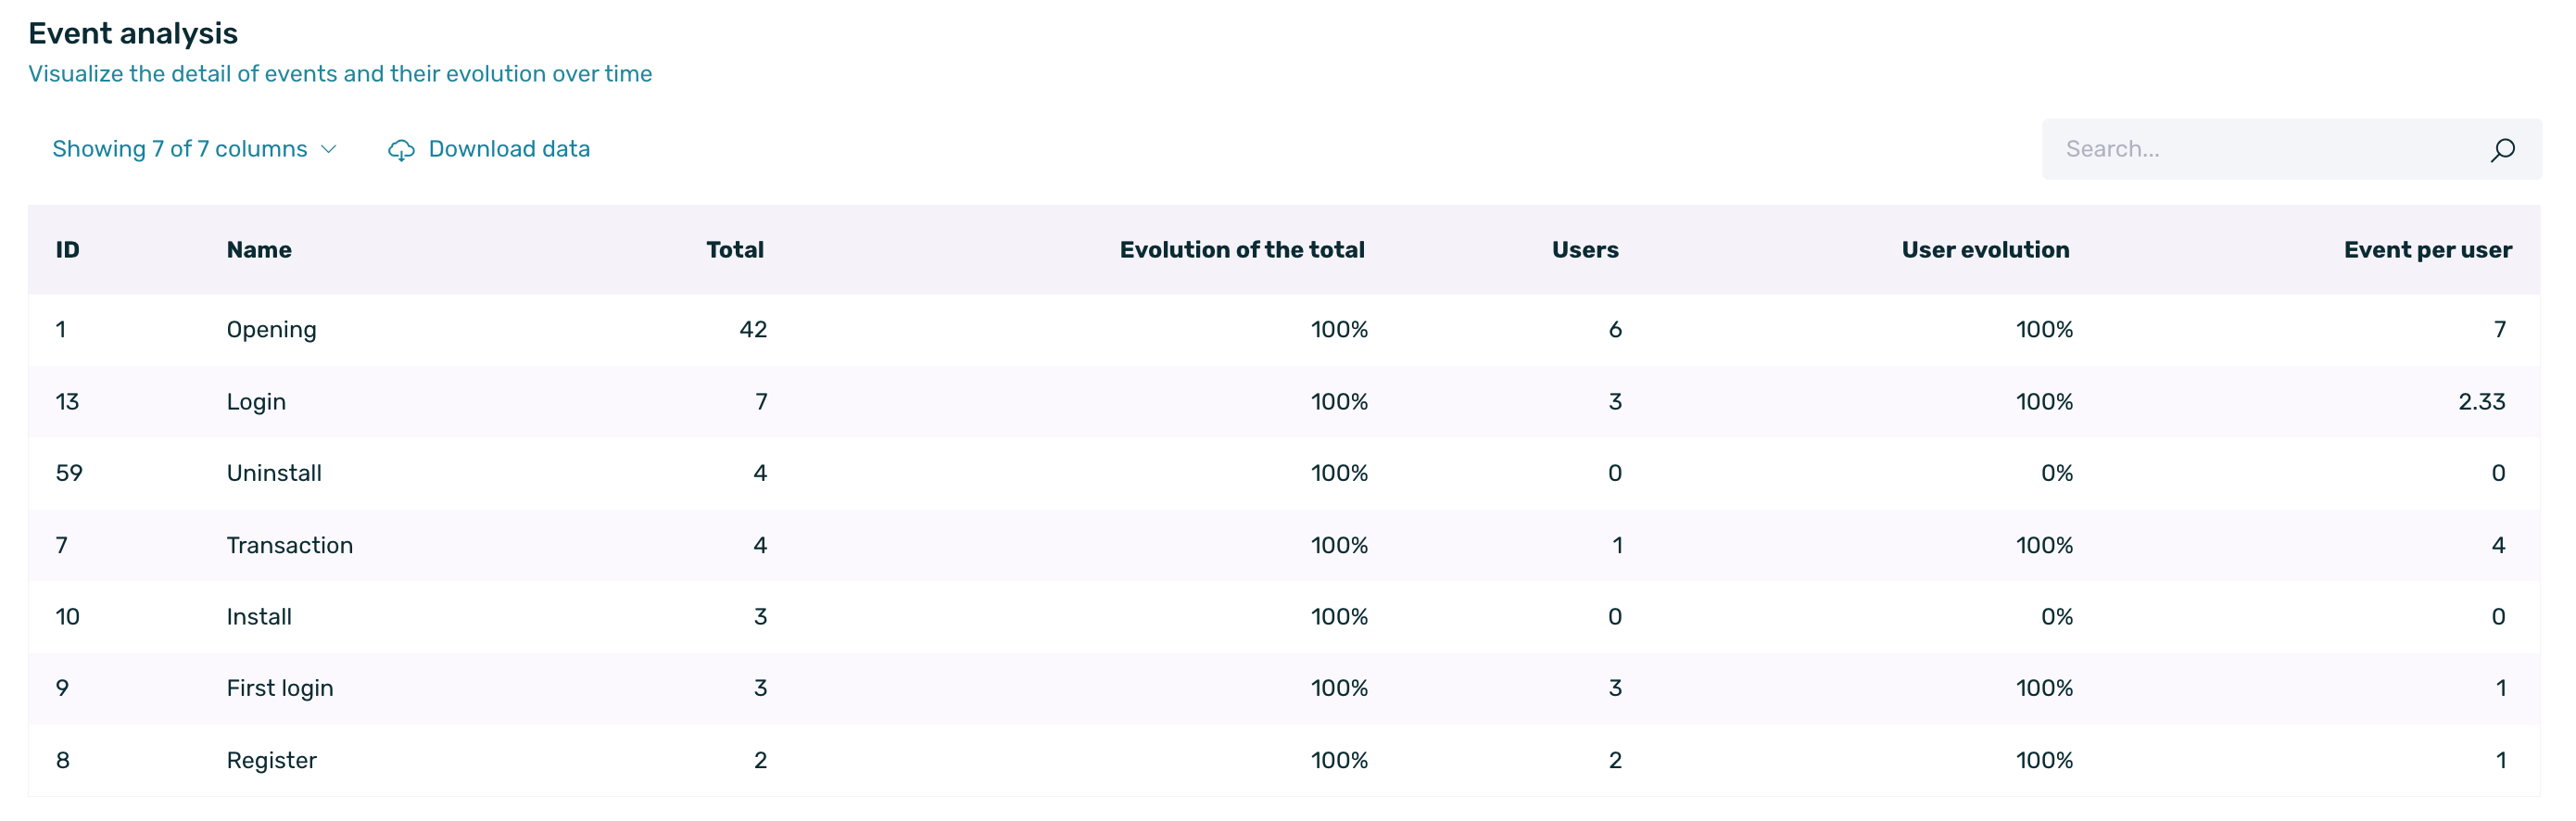
In the Event analysis table, you can see the following information:
- ID: Identifier of the event in EMMA.
- Name: Name of the event in EMMA.
- Total: Total number of times each event has occurred within the selected date range.
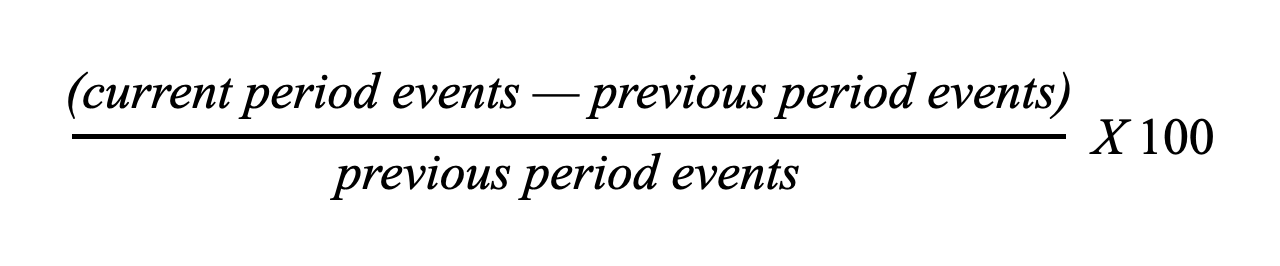
- Evolution of the total: Increase or decrease in the event volume compared to the immediately preceding period. It is calculated as follows:
- Users: Different client IDs who have performed the event.
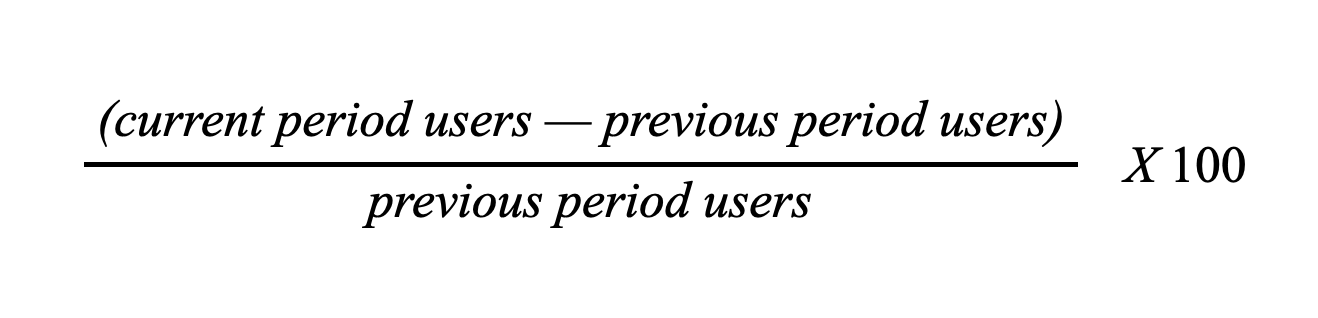
- User evolution: Increase or decrease in the volume of users compared to the immediately previous period. It is calculated as follows:
- Event per user: Average number of events performed by each user.
¶ View event
Within the Event Analysis table, by opening the three-dot menu, you will find the View option.
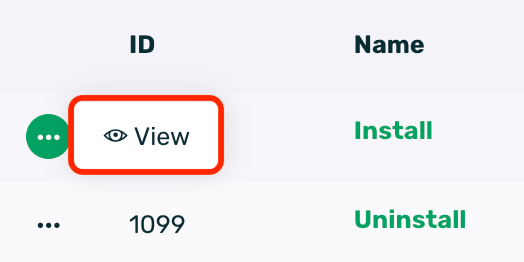
This feature allows you to access more detailed and specific information about each event recorded in your application, whether it is a custom event or one of EMMA’s default events.
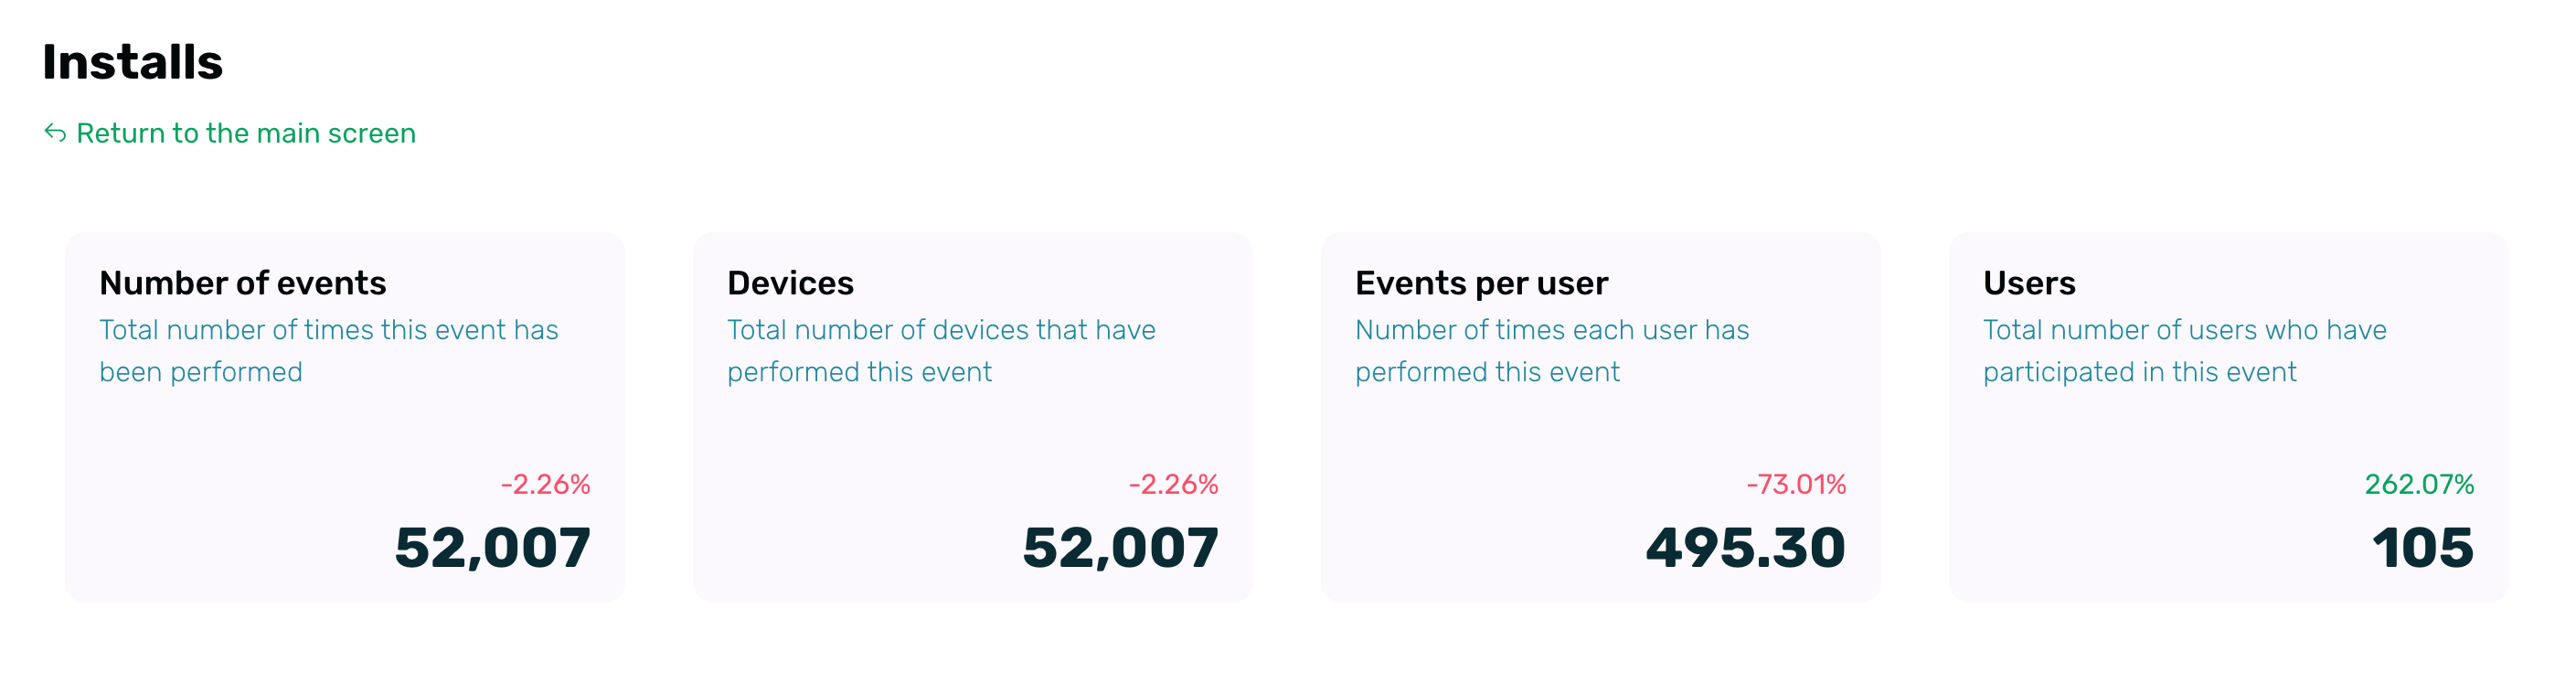
By selecting this option, you will access a detailed view where you will find:
-
Number of events: Total number of times the event has been performed.
-
Devices: Number of unique devices that have performed this event.
-
Events per user: Number of times each user has performed this event.
-
Users: Shows the total number of unique users (client IDs) who have performed the event.
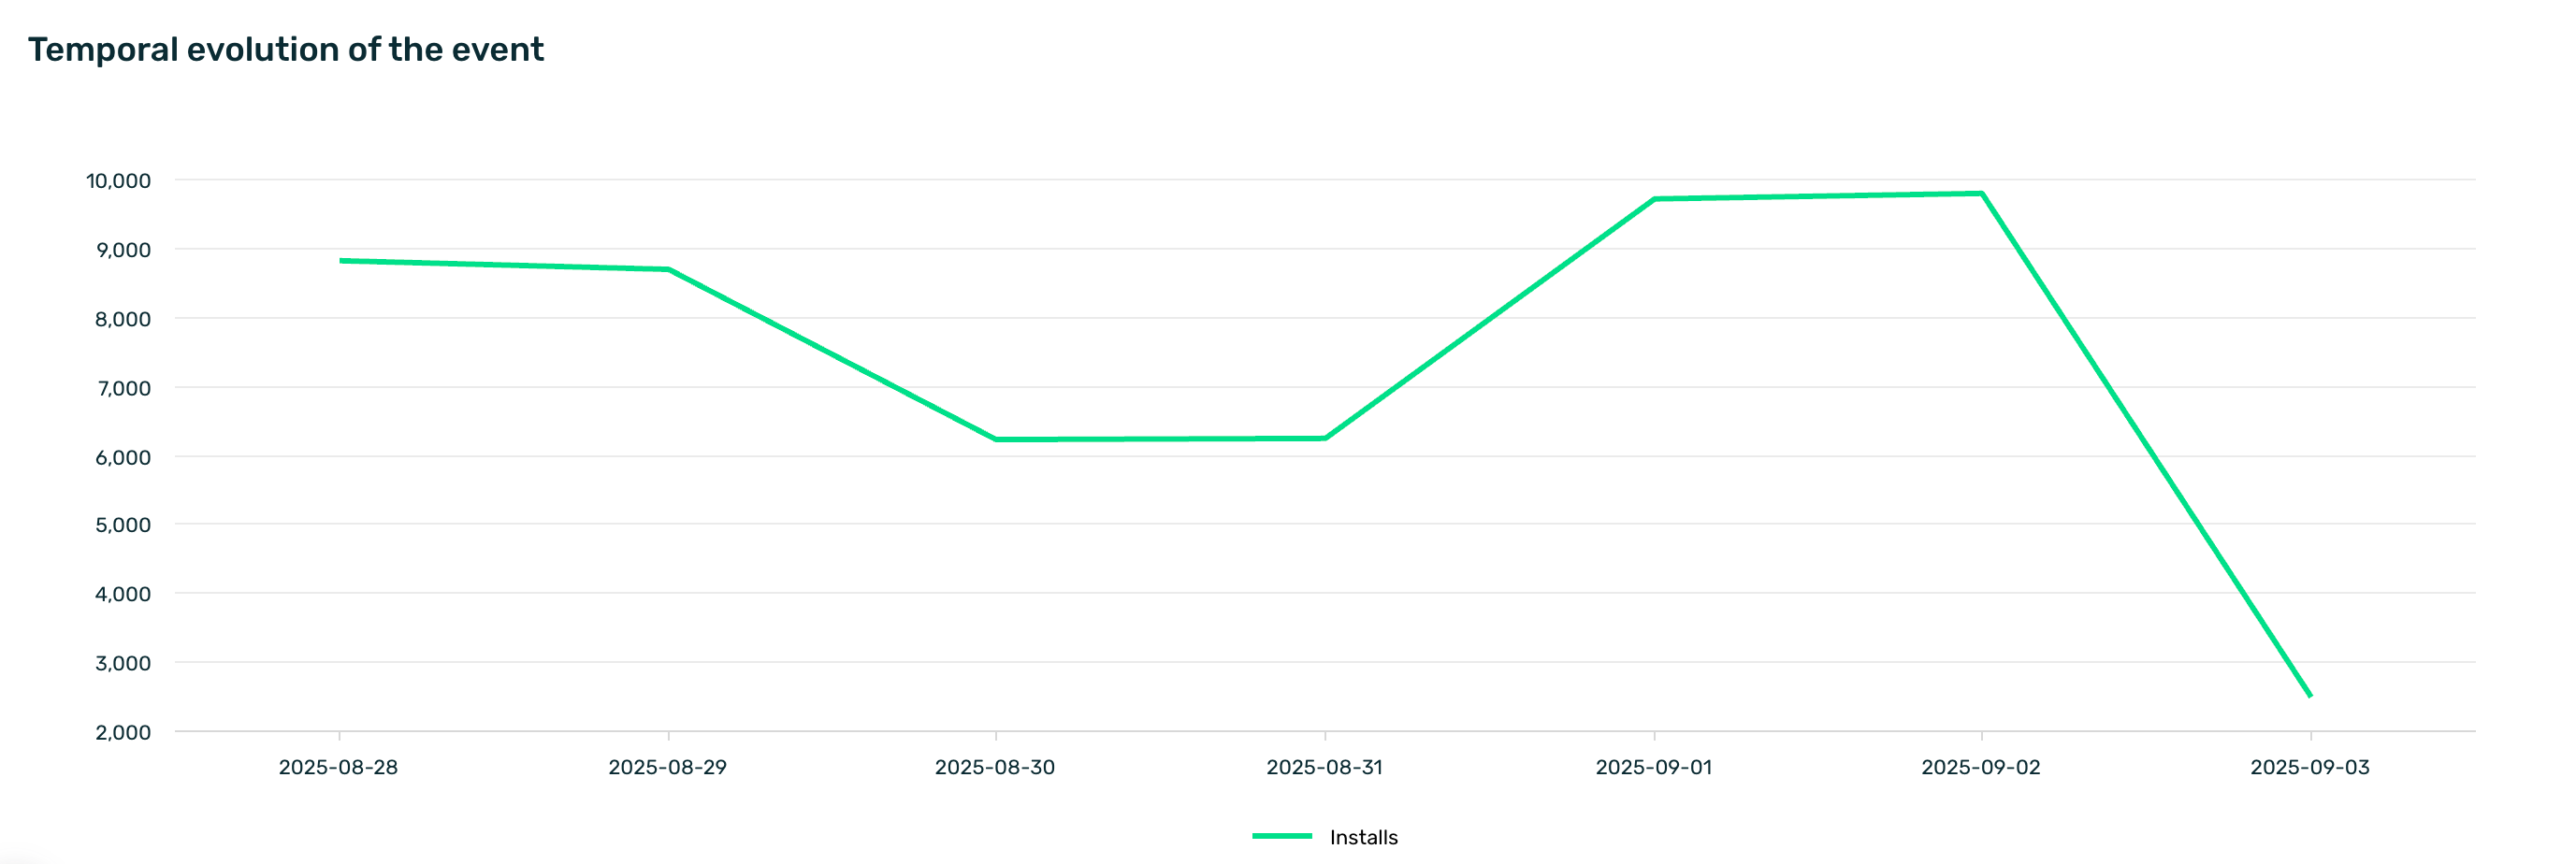
In addition to these indicators, a time evolution chart is displayed, allowing you to analyze how the occurrence of the event has changed over time.
At the bottom of this screen, you’ll find the attribute values table. This section allows you to analyze event behavior based on the different attributes you’ve configured.
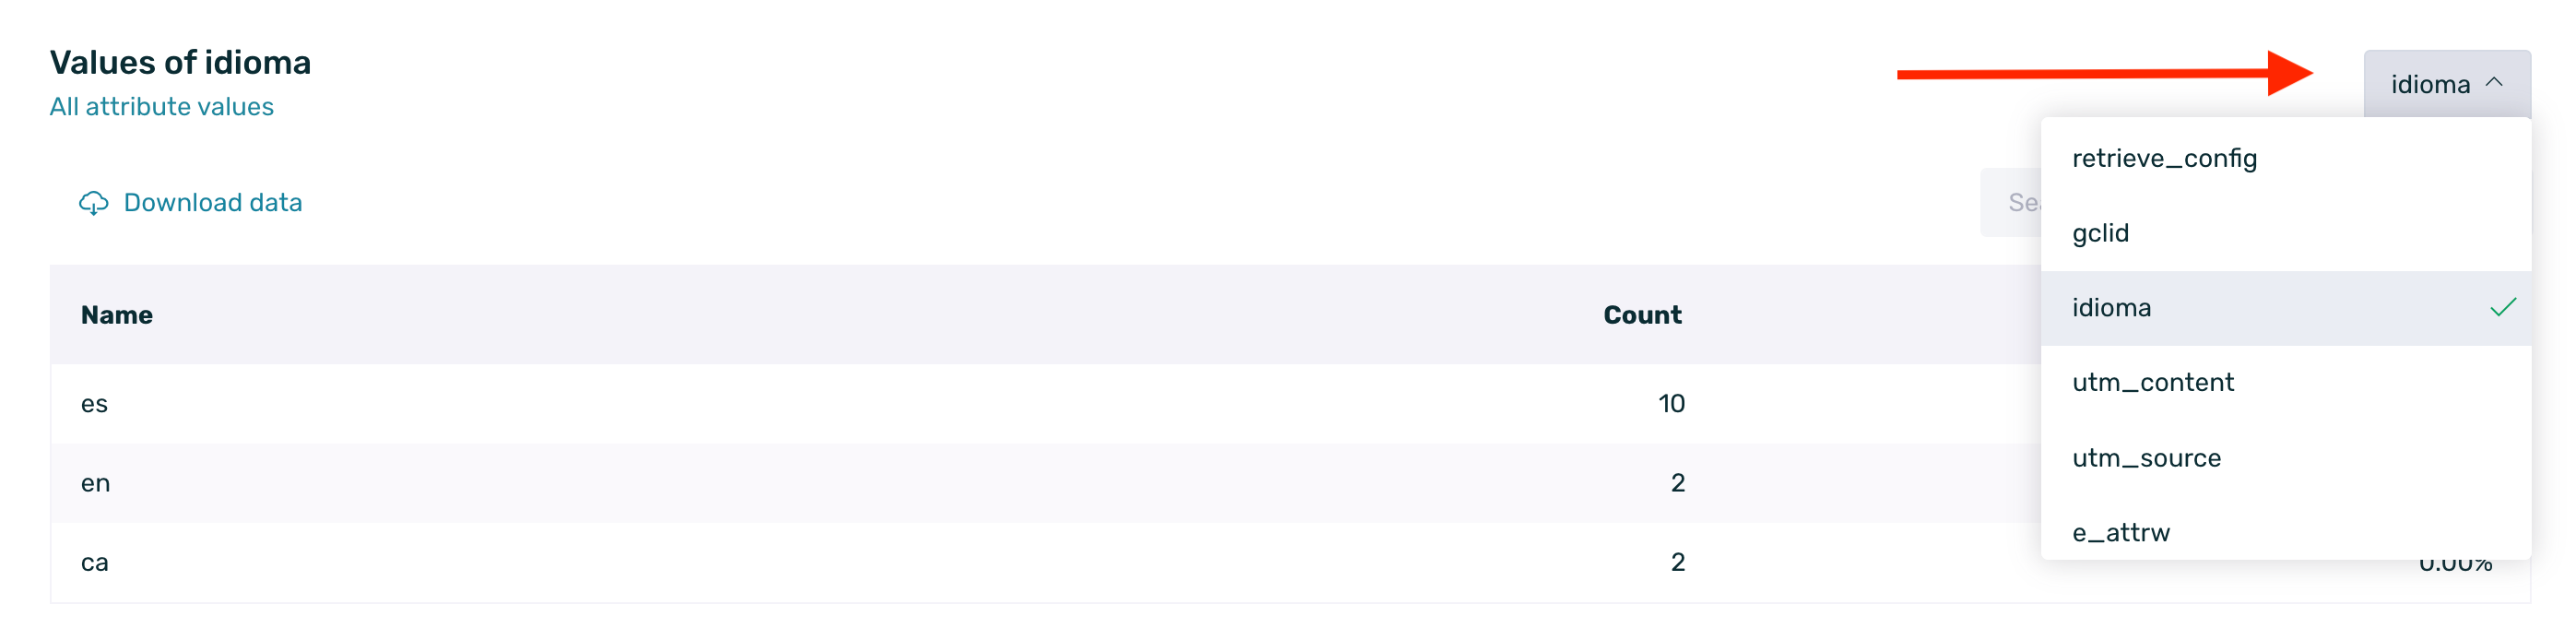
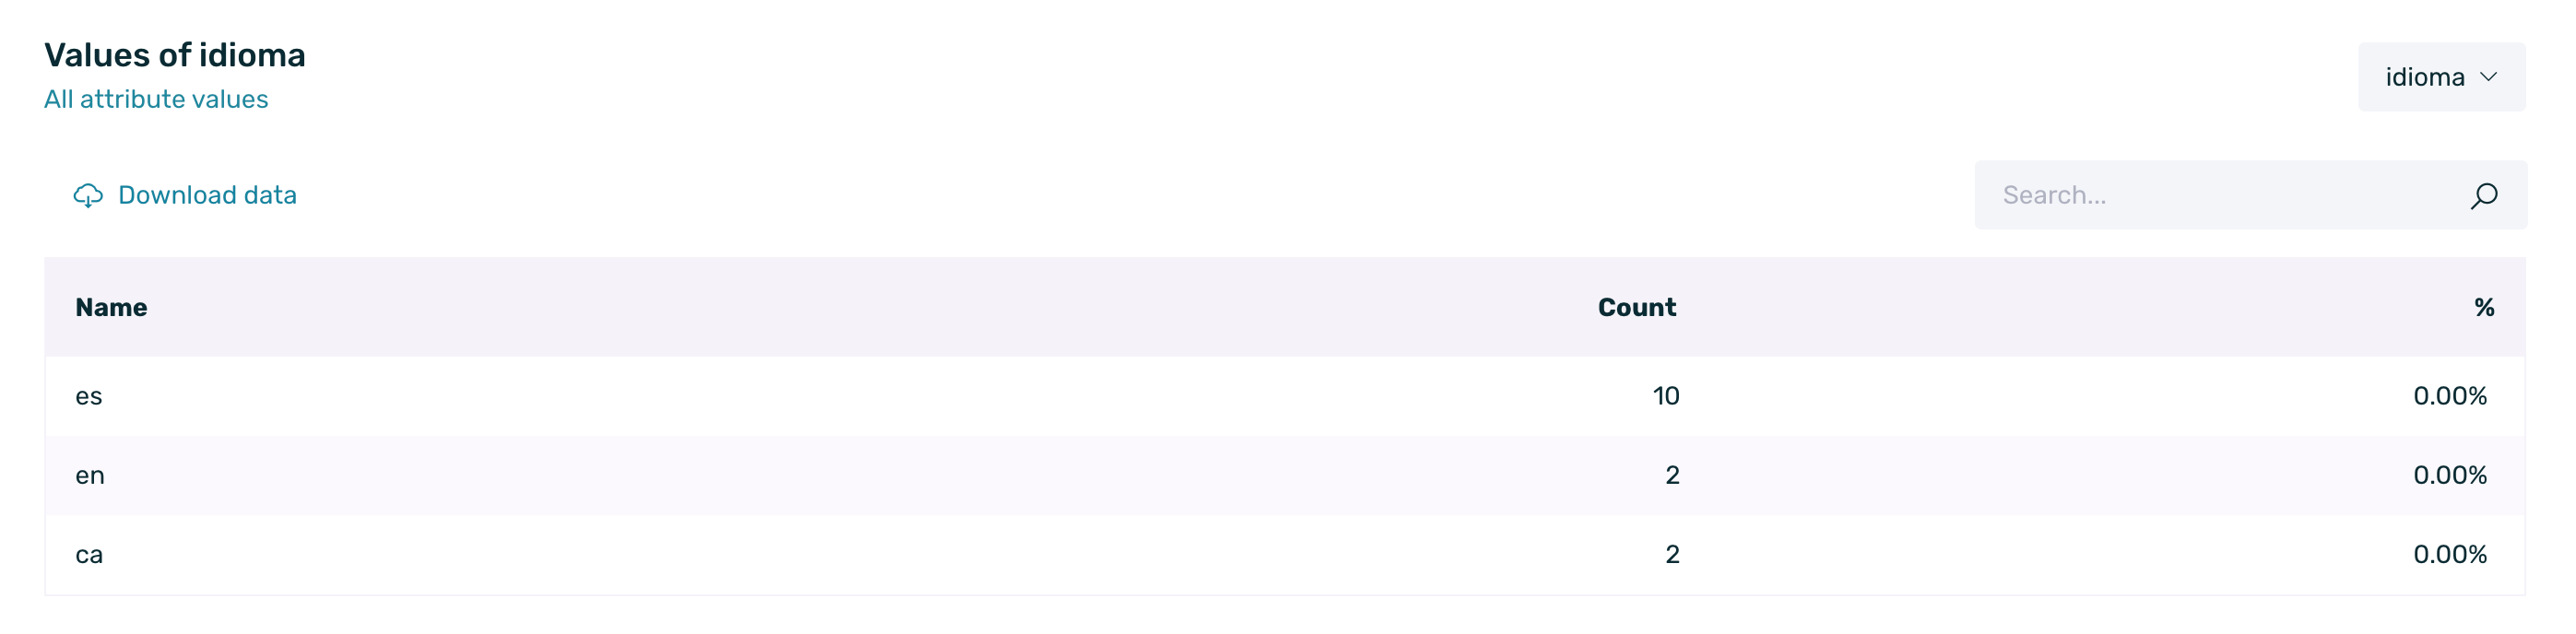
When selecting a specific attribute from the dropdown, the table will display the following fields:
-
Name: Corresponds to the specific value within the selected attribute. For example, if you choose the Language attribute, this column will display the different languages in which the event has been recorded (Spanish, English, French, etc.).
-
Count: Shows the total number of times the event has been recorded with that attribute value. Using the previous example, you could see how many times the event occurred in Spanish, in English, and so on.
-
%: Indicates the percentage each value represents relative to the total number of times the event was recorded. This allows you to quickly identify which language has the most activity for that event.
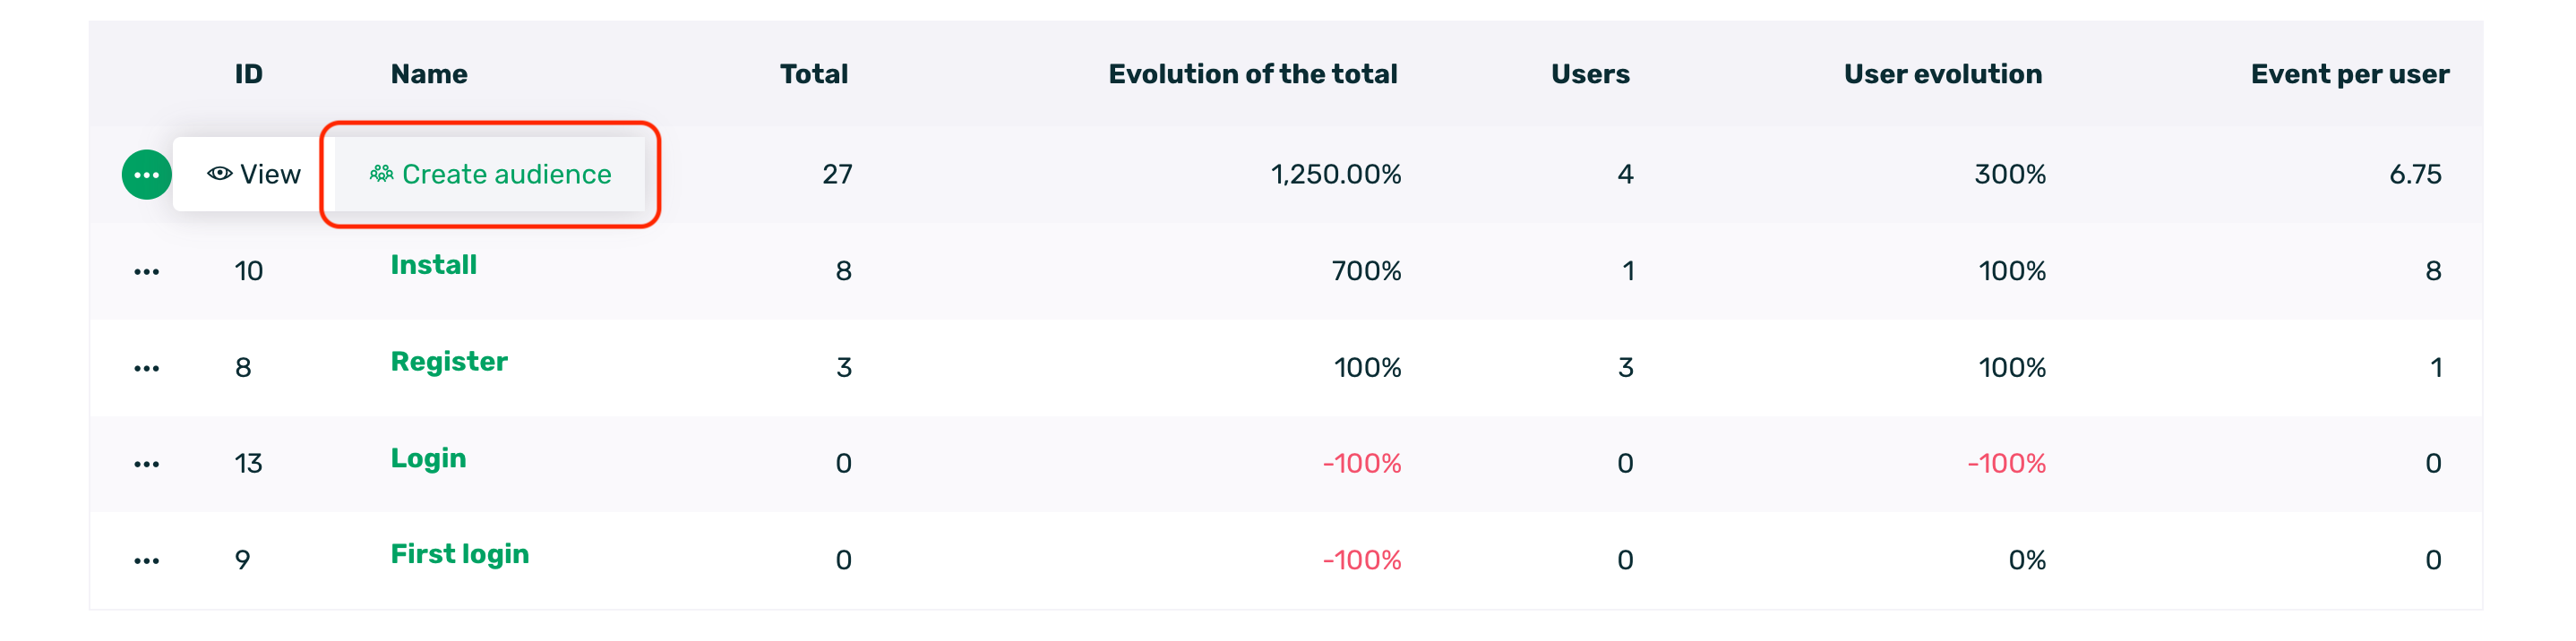
¶ Create audience
The Create audience button within the Event Analysis section allows you to instantly transform user behavior into actionable segments.
This tool captures the users who have triggered a specific event under the filtering conditions currently applied.
This option is available in the three-dot menu of the table:
When activated, the Create new audience pop-up will open.
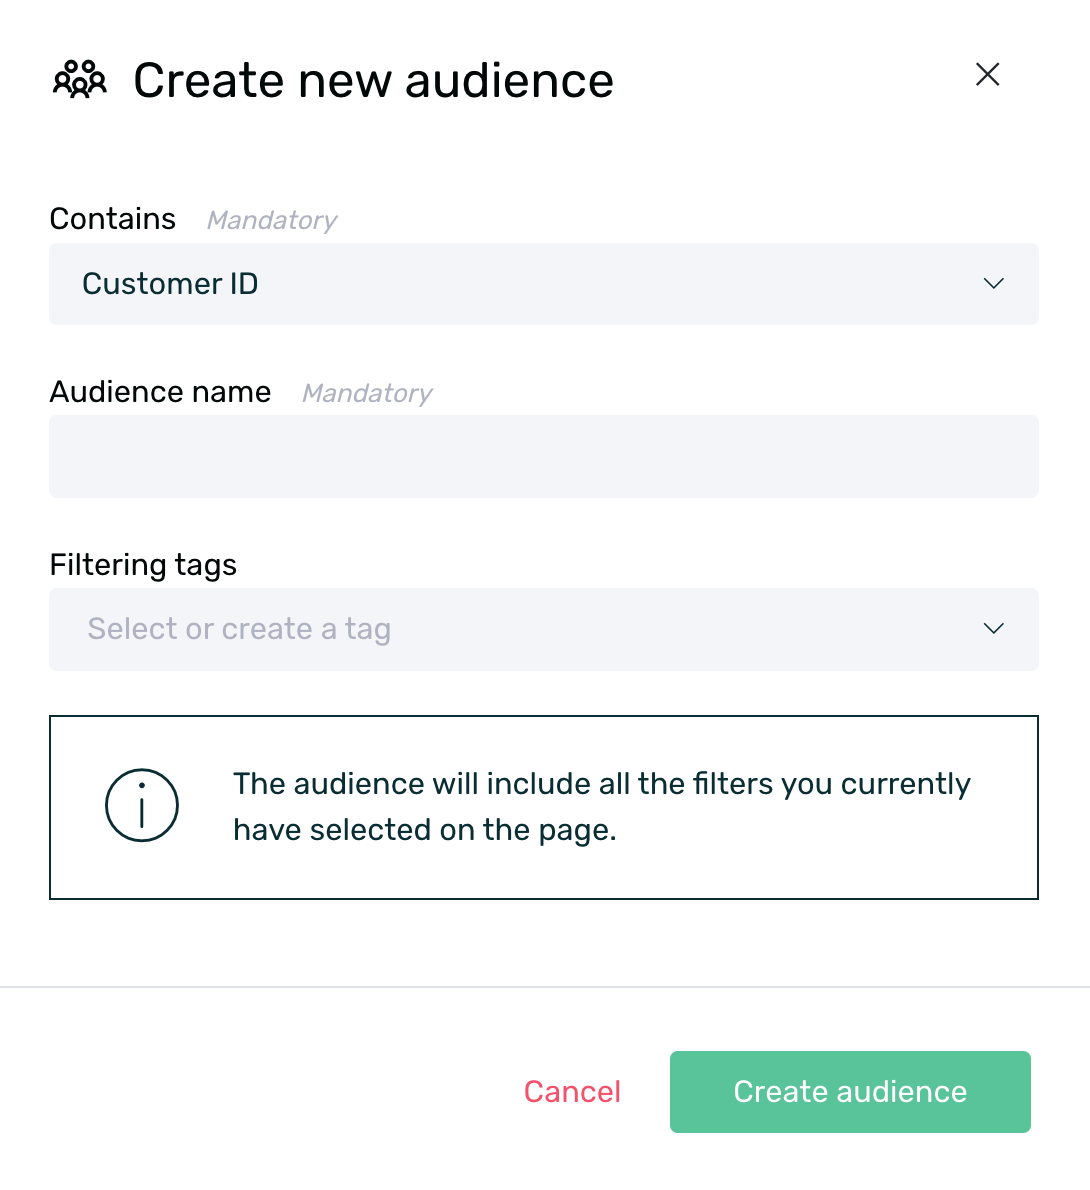
-
Contains: Select the identifier you want to use (e.g., Customer ID).
-
Audience name: Assign a descriptive name for the segment.
-
Filtering tags: Optionally, add tags to organize your audiences.
To finish, click Create audience to generate a static audience in EMMA, or Cancel to close the window without saving.