¶ Introduction
Once the A/B test communications are launched and generating data, it's important to know which one is performing the best based on the objectives set for that communication.
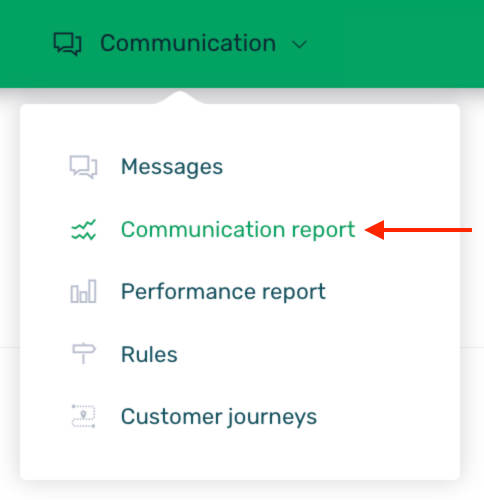
To do this, you can analyze the data and view the communication with the best performance from the Communication > Communication Report section.
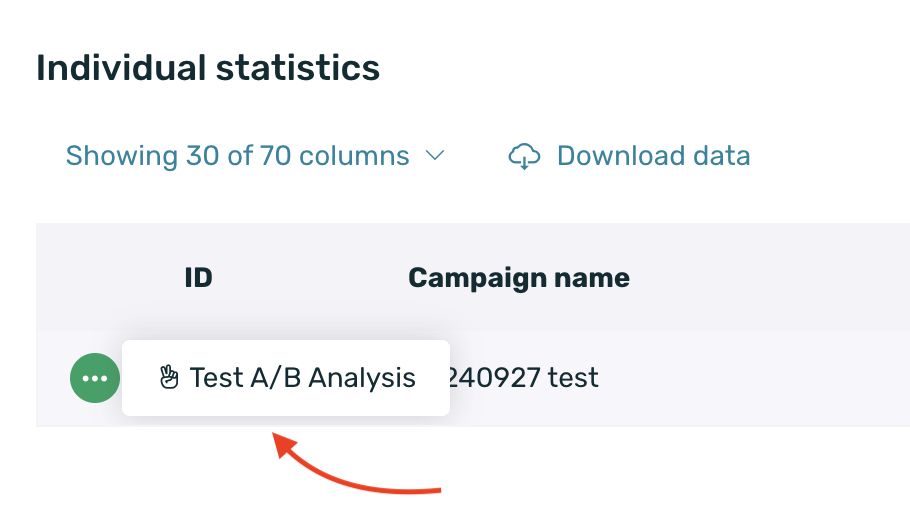
To view the specific data for A/B test communications, we need to scroll down to the table with all communications and search for the desired communication. Since it is an A/B test communication, next to the Status column, we will see three vertical dots in the form of a menu. It is from that contextual menu that you will access the specific A/B test report.
¶ Test A/B report
Once you access the report, you will encounter three distinct sections. On one hand, there is a summary with general data, followed by the data for each of the campaigns that form the A/B testing and have collected data. Lastly, there is a table similar to the classic report, displaying all the activity recorded by each campaign.
¶ General data
Before anything, it is necessary to select the target event for the campaign in the dropdown menu at the top left of the screen. This event will be the target KPI on which the campaign's performance will be determined.
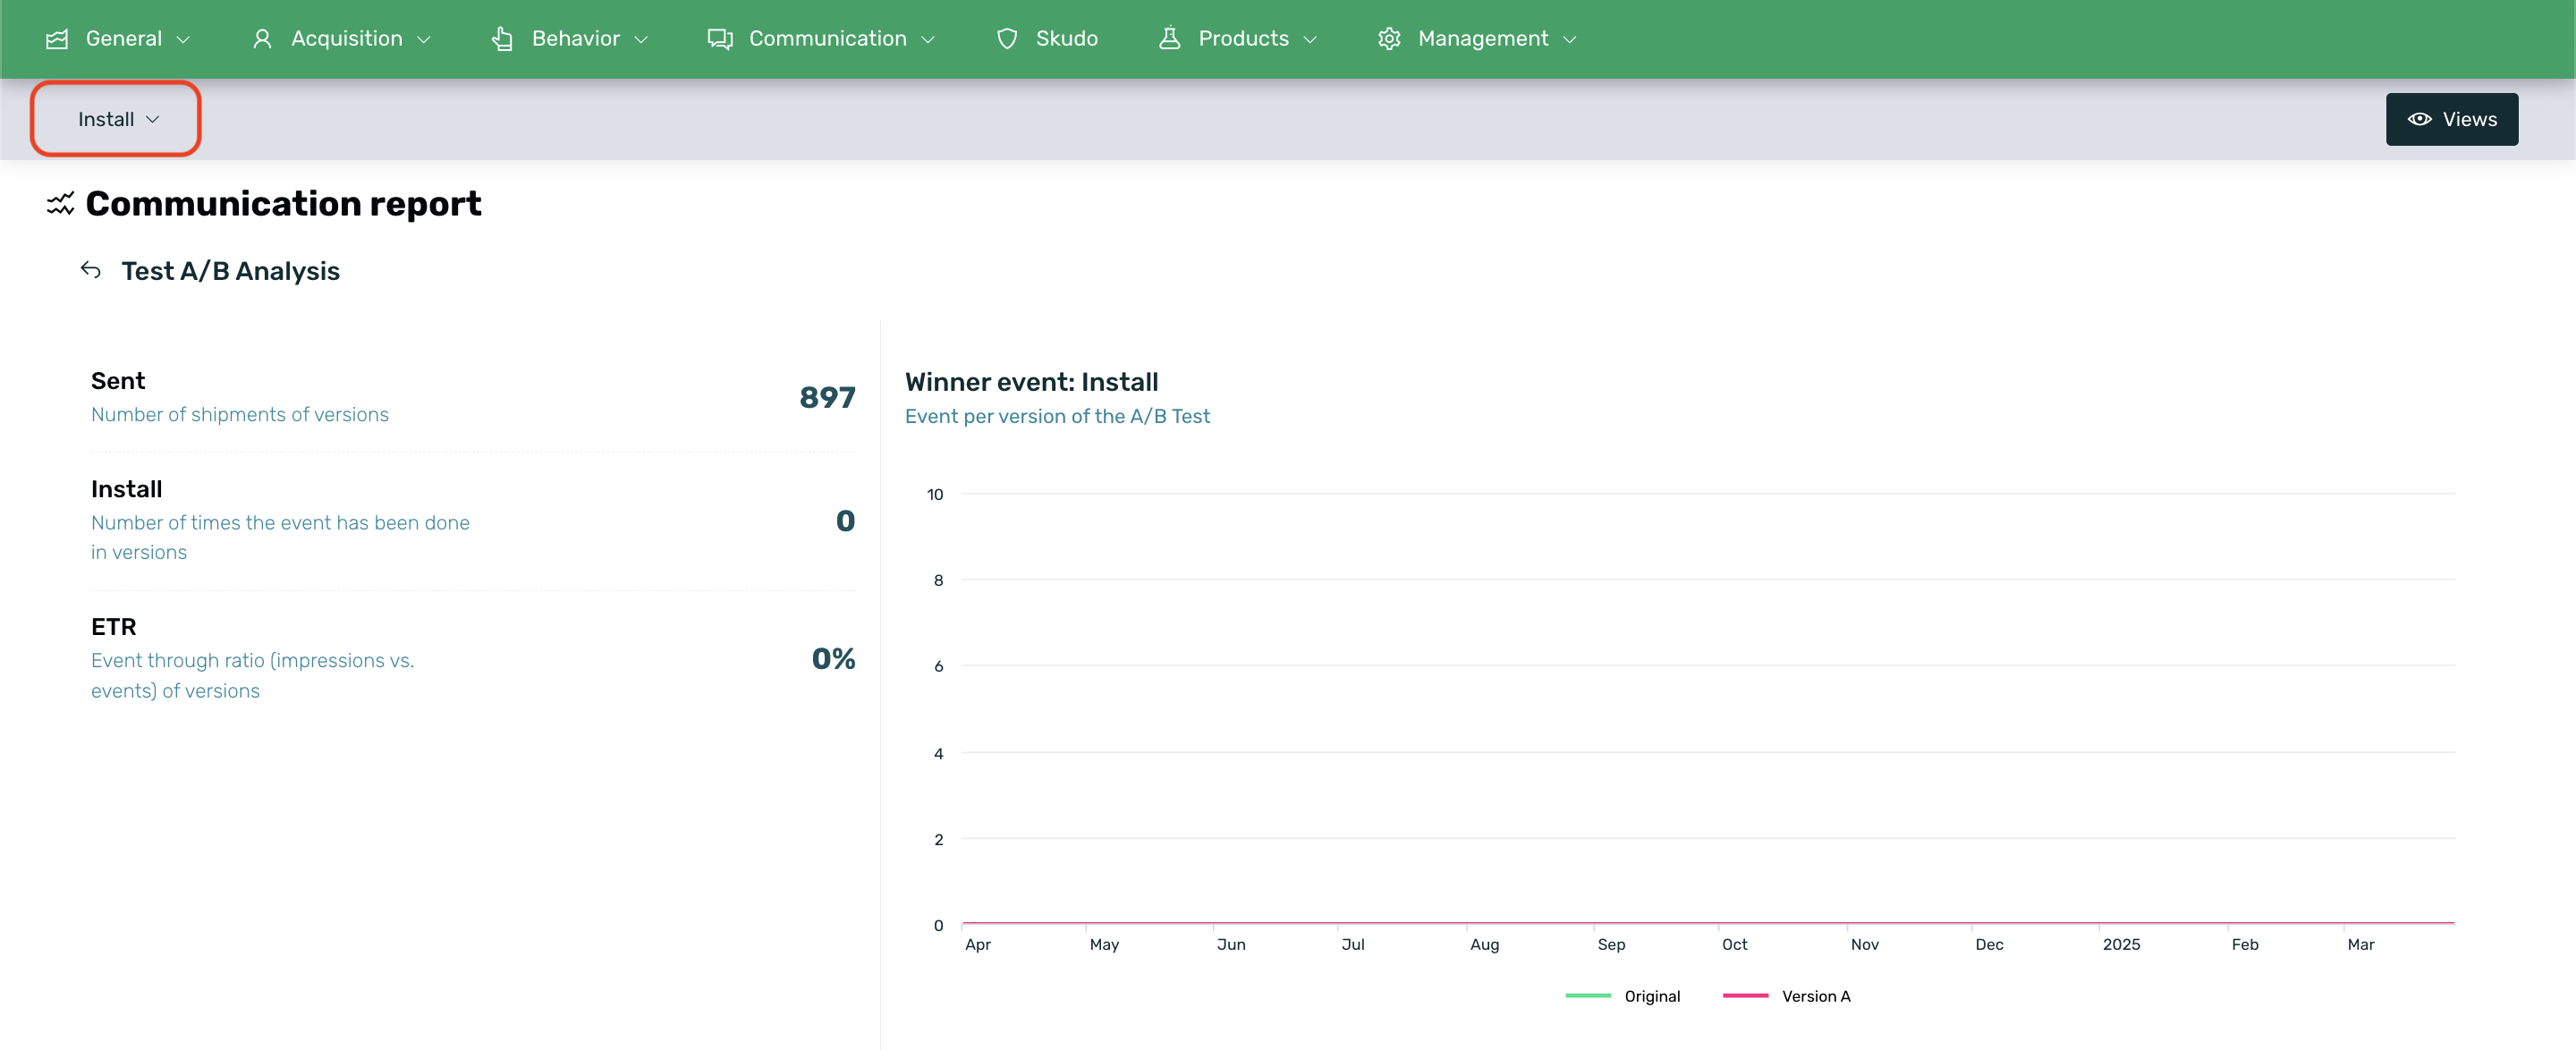
In this first part of the report, general (total) data for the campaigns will be shown, such as impressions, unique impressions, clicks (or the selected target event), and ETR. Additionally, a graph will display data for the target event of each campaign.
The ETR is the Event Through Ratio and is the KPI used to determine the "winning" campaign in the A/B Test. This KPI is calculated by dividing the events by the impressions of each version. The version with the highest ETR, or the best conversion rate, will be the winning version.
¶ Versions
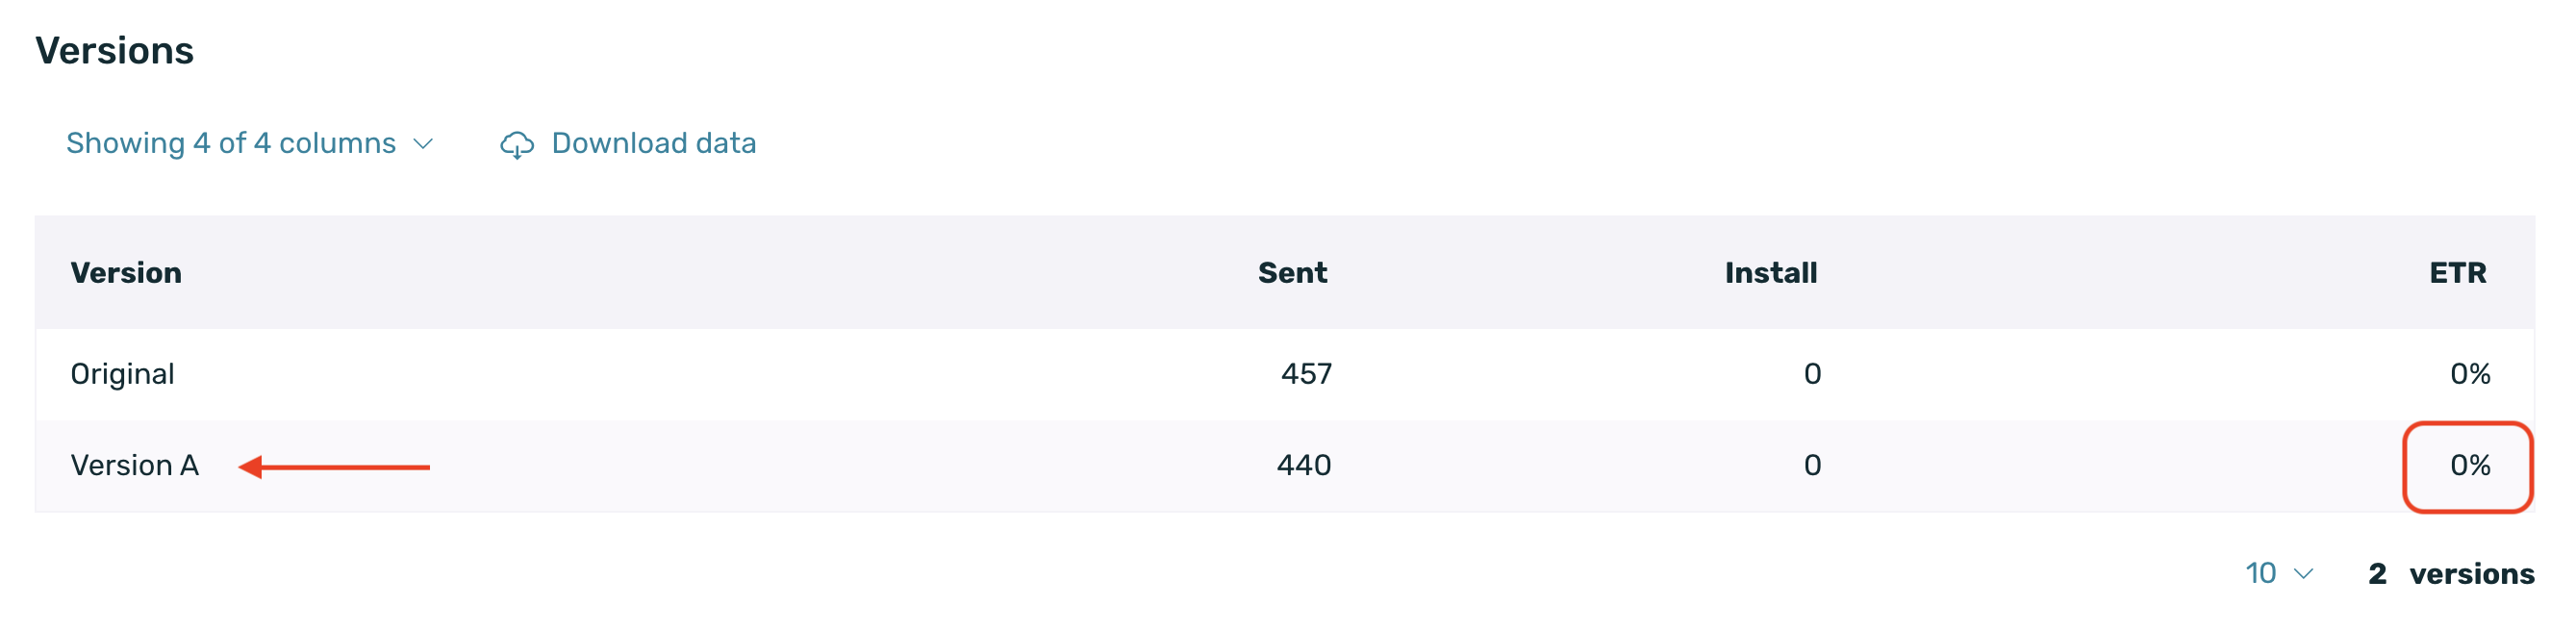
The second chart will display the winner of the A/B test based on the ETR. The winning campaign will be marked with a trophy icon before the name.
This chart will only show the KPIs used to determine the winner. Therefore, it will only display data on impressions, unique impressions, the target event, and ETR.
- Version: Name of the version. The possibilities are Original, Version A, Version B, and Version C.
- Impressions: The number of times the communication has been shown (total impressions).
- Unique Impressions: The number of unique devices on which the communications have been displayed.
- Target Event: The column clicks will change its name depending on the selected target event. It shows the number of times the user performs the target event.
- ETR: Event Through Ratio. The event-to-impression ratio.
The target event will change in the column based on the event selected previously (refer to the General Data section above). In this specific example, the target event is clicks.
¶ Individual statistics
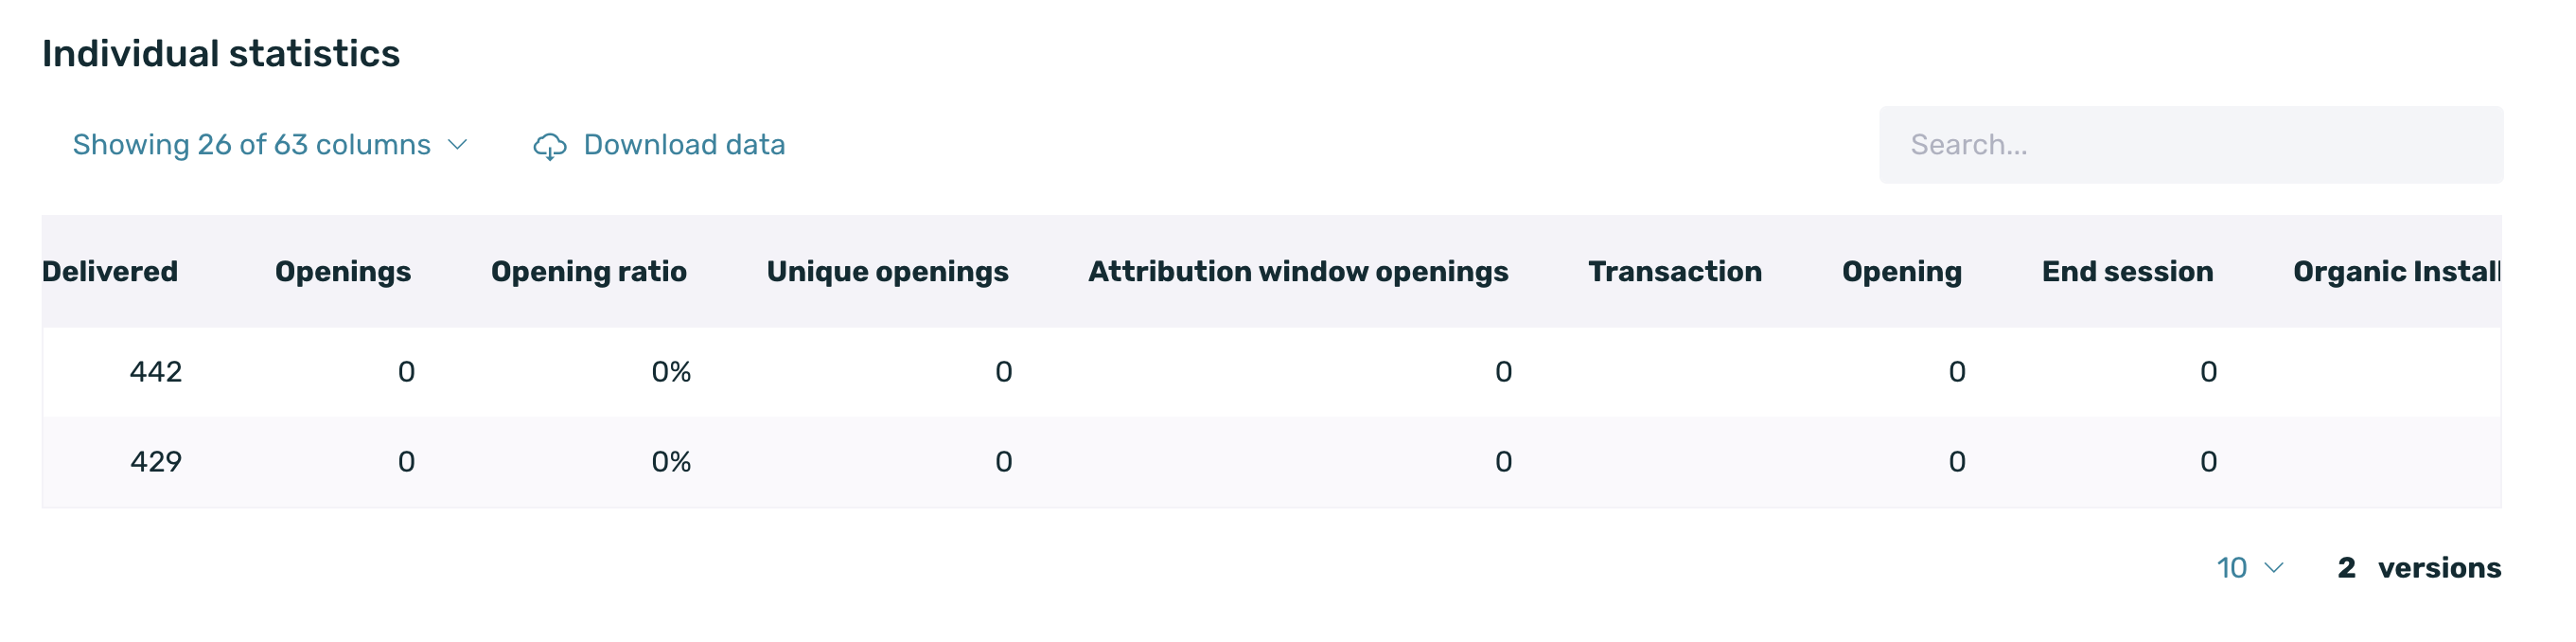
Similarly, in the last chart of Individual Statistics, you can view all the activity associated with the campaigns, just like in the classic communication report with any other communication.
| Version | Name of the communication version. The options are Original, Version A, Version B, and Version C. |
| Impressions | Number of times the communication has been shown (total impressions). |
| Unique Impressions | Number of unique devices on which the communications were shown. |
| Clicks | Number of times the user interacts with the communication. |
| Default and Custom Events | Measurement of events defined for your application. |
With this new Communication Report, you should keep in mind:
- The Communication Report is updated every 2 hours. Please note that the update time may vary depending on the volume of data being collected.
- Data is displayed based on the dates you have selected. They are NOT cumulative.
- Even if a campaign is active, if no data has been collected during the selected dates, it will export as shown in the table.
- Campaigns that have been deleted before collecting data will not be shown.
- If you export the Individual Statistics table, it will be exported as you see it in the table, and only the selected KPI and campaign columns will appear.